
Here are the latest charts and statistics for the Commitment of Traders (COT) data published by the Commodities Futures Trading Commission (CFTC). The latest COT data is updated through Tuesday, Feb. 22, and shows a quick view of how large traders (for-profit speculators and commercial entities) were positioned in the futures markets.
Highlighting the COT bonds data was the large increase in bearish bets for the 10-Year Bonds. The speculative bearish position in the United States 10-Year jumped this week by -111,029 contracts and marked the largest one-week rise in bearish positions since November 2nd, a span of sixteen weeks.
This decline in sentiment has pushed the overall 10-Year spec positioning to the most bearish level of the past six weeks. Most of the bonds markets we cover saw an increase in their bearish bets this week as the Federal Reserve central bank is widely expected to raise its benchmark interest rate in March.
Joining the 10-Year (-111,029 contracts) with speculator weakness this week were the Eurodollar (-89,630 contracts), United States 2-Year Bond (-4,201 contracts), Fed Funds (-49,473 contracts), United States 5-Year Bond (-155,821 contracts) and the Ultra US Treasury Bond (-4,242 contracts). The Ultra 10-Year U.S. Treasury Note (9,672 contracts) and Long US Bond (10,107 contracts) saw a small improvement in their speculator contracts this week.
3-Month Eurodollars Futures
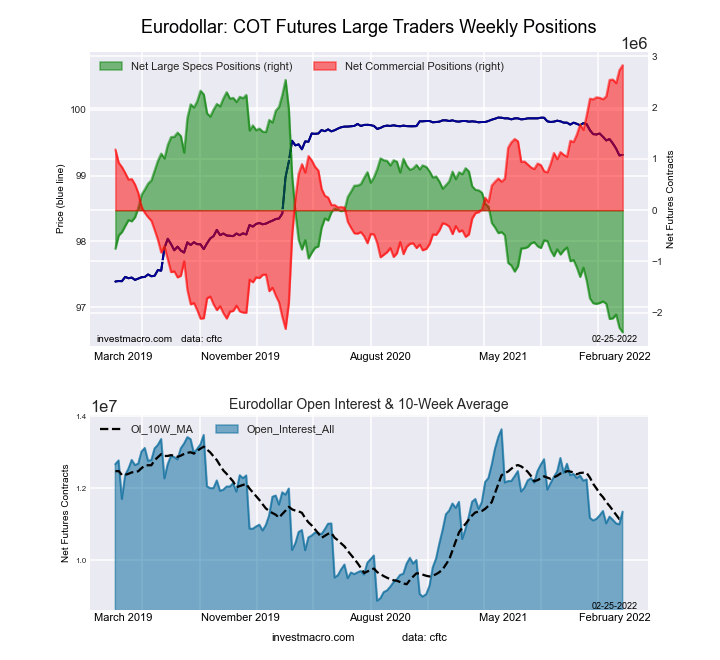
The 3-Month Eurodollars large speculator standing this week was a net position of -2,382,867 contracts in the data reported through Tuesday. This was a weekly lowering of -89,630 contracts from the previous week which had a total of -2,293,237 net contracts.
This week’s current strength score (the trader positioning range over the past three years, measured from 0 to 100) shows the speculators are currently Bearish-Extreme with a score of 0.0 percent. The commercials are Bullish-Extreme with a score of 100.0 percent and the small traders (not shown in chart) are Bearish-Extreme with a score of 6.0 percent.
30-Day Federal Funds Futures
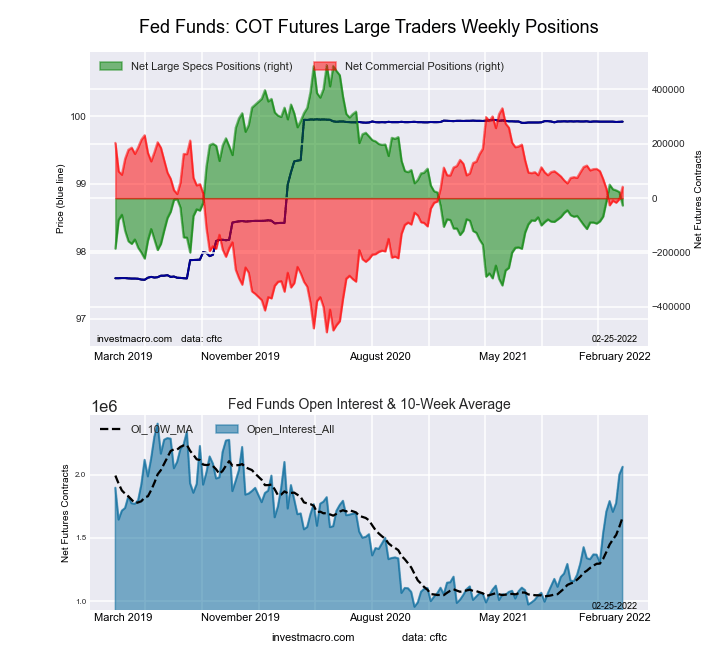
The 30-Day Federal Funds large speculator standing this week was a net position of -26,952 contracts in the data reported through Tuesday. This was a weekly decline of -49,473 contracts from the previous week which had a total of 22,521 net contracts.
This week’s current strength score (the trader positioning range over the past three years, measured from 0 to 100) shows the speculators are currently Bearish with a score of 36.3 percent. The commercials are Bullish with a score of 64.9 percent and the small traders (not shown in chart) are Bearish with a score of 25.2 percent.
2-Year Treasury Note Futures
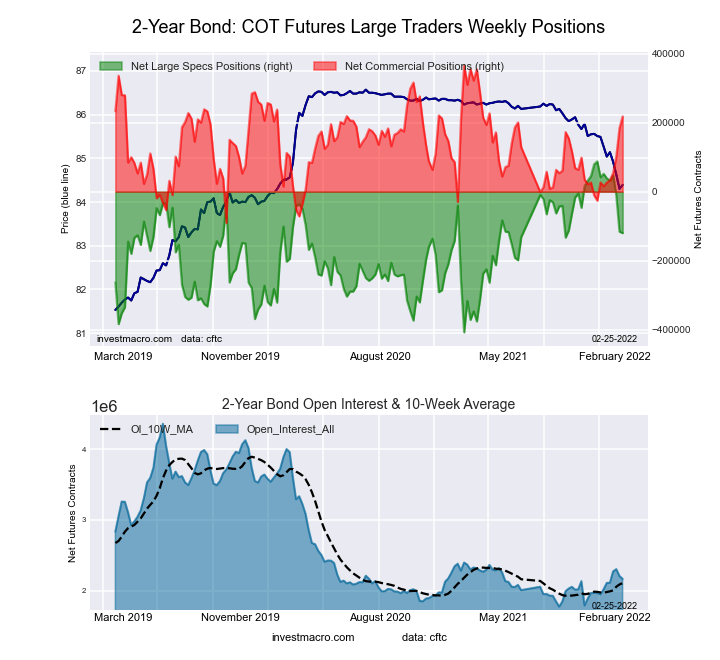
The 2-Year Treasury Note large speculator standing this week was a net position of -119,959 contracts in the data reported through Tuesday. This was a weekly reduction of -4,201 contracts from the previous week which had a total of -115,758 net contracts.
This week’s current strength score (the trader positioning range over the past three years, measured from 0 to 100) shows the speculators are currently Bullish with a score of 58.0 percent. The commercials are Bullish with a score of 67.5 percent and the small traders (not shown in chart) are Bearish-Extreme with a score of 1.5 percent.
5-Year Treasury Note Futures
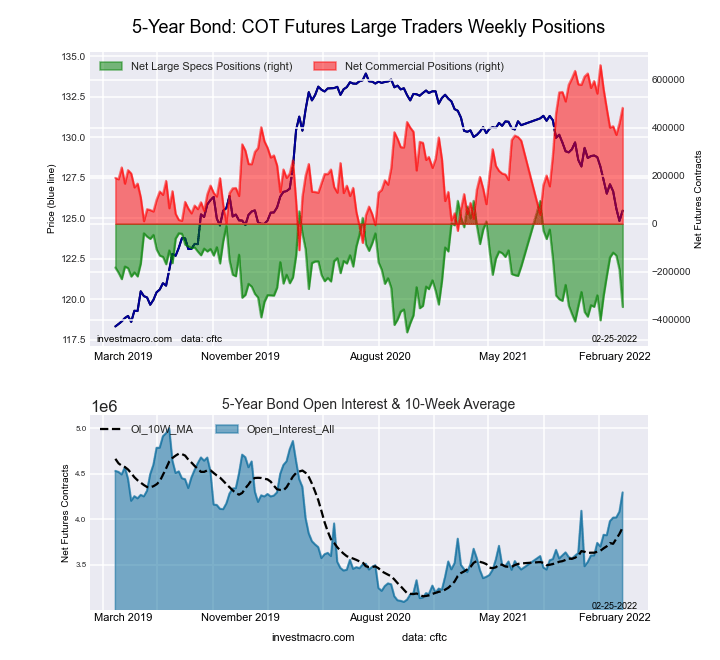
The 5-Year Treasury Note large speculator standing this week was a net position of -347,236 contracts in the data reported through Tuesday. This was a weekly decrease of -155,821 contracts from the previous week which had a total of -191,415 net contracts.
This week’s current strength score (the trader positioning range over the past three years, measured from 0 to 100) shows the speculators are currently Bearish-Extreme with a score of 19.3 percent. The commercials are Bullish with a score of 76.9 percent and the small traders (not shown in chart) are Bearish with a score of 43.6 percent.
10-Year Treasury Note Futures
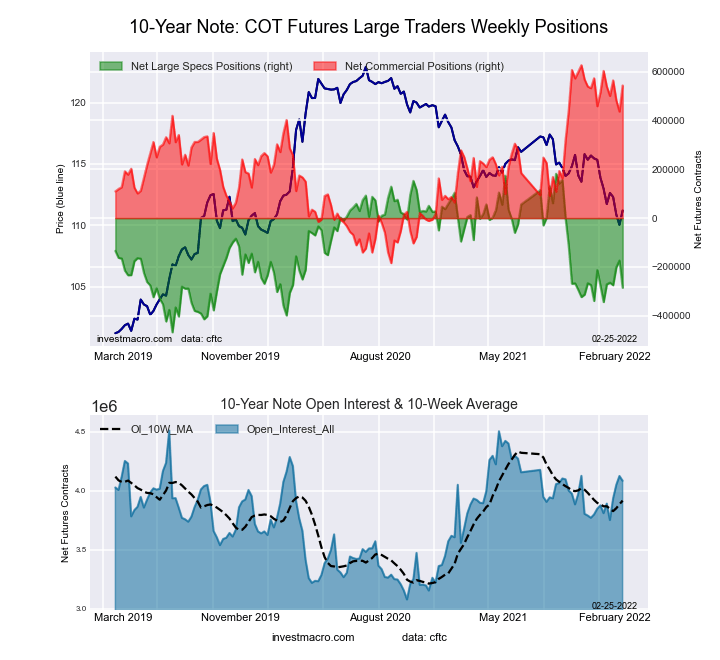
The 10-Year Treasury Note large speculator standing this week was a net position of -285,092 contracts in the data reported through Tuesday. This was a weekly decrease of -111,029 contracts from the previous week which had a total of -174,063 net contracts.
This week’s current strength score (the trader positioning range over the past three years, measured from 0 to 100) shows the speculators are currently Bearish with a score of 28.1 percent. The commercials are Bullish-Extreme with a score of 89.8 percent and the small traders (not shown in chart) are Bearish-Extreme with a score of 18.6 percent.
Ultra 10-Year Notes Futures
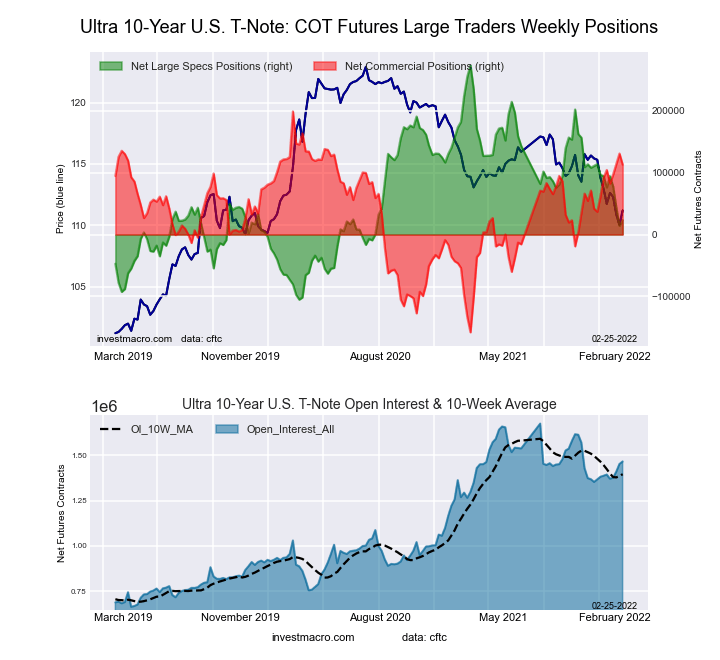
The Ultra 10-Year Notes large speculator standing this week was a net position of 23,543 contracts in the data reported through Tuesday. This was a weekly boost of 9,672 contracts from the previous week which had a total of 13,871 net contracts.
This week’s current strength score (the trader positioning range over the past three years, measured from 0 to 100) shows the speculators are currently Bearish with a score of 34.0 percent. The commercials are Bullish with a score of 75.9 percent and the small traders (not shown in chart) are Bearish with a score of 33.3 percent.
US Treasury Bonds Futures
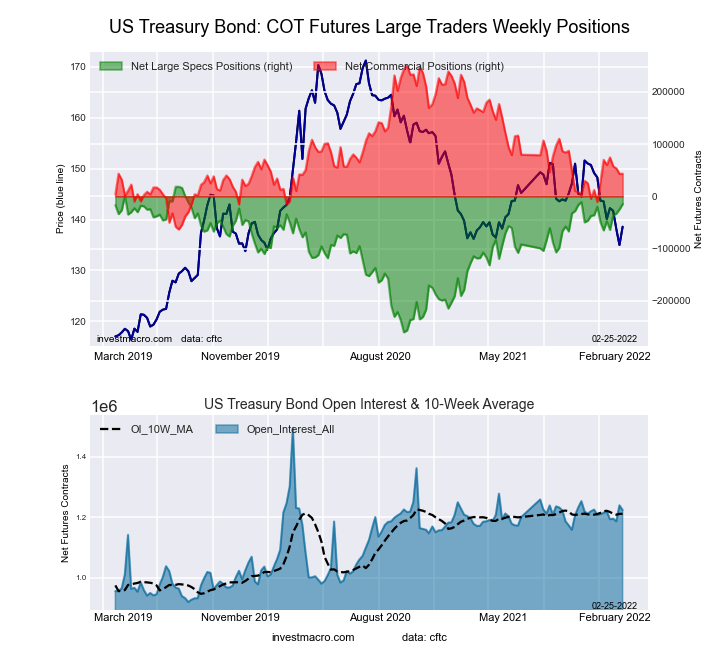
The US Treasury Bonds large speculator standing this week was a net position of -14,738 contracts in the data reported through Tuesday. This was a weekly lift of 10,107 contracts from the previous week which had a total of -24,845 net contracts.
This week’s current strength score (the trader positioning range over the past three years, measured from 0 to 100) shows the speculators are currently Bullish-Extreme with a score of 88.1 percent. The commercials are Bearish with a score of 33.9 percent and the small traders (not shown in chart) are Bearish with a score of 29.9 percent.
Ultra US Treasury Bonds Futures
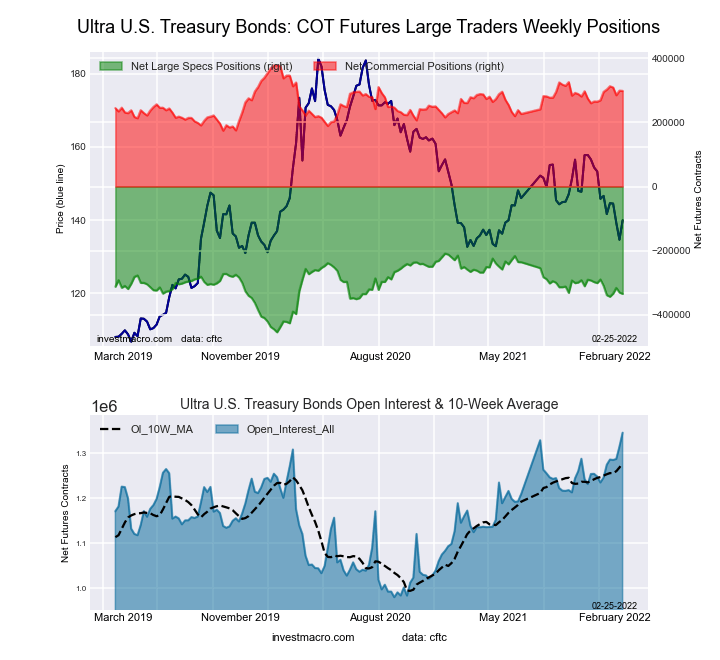
The Ultra US Treasury Bonds large speculator standing this week was a net position of -334,381 contracts in the data reported through Tuesday. This was a weekly lowering of -4,242 contracts from the previous week which had a total of -330,139 net contracts.
This week’s current strength score (the trader positioning range over the past three years, measured from 0 to 100) shows the speculators are currently Bearish with a score of 48.8 percent. The commercials are Bullish with a score of 60.7 percent and the small traders (not shown in chart) are Bullish with a score of 54.6 percent.