
Here are the latest charts and statistics for the Commitment of Traders (COT) data published by the Commodities Futures Trading Commission (CFTC).
The latest COT data is updated through Tuesday, Mar. 8 and shows a quick view of how large traders (for-profit speculators and commercial entities) were positioned in the futures markets. Highlighting the COT bonds data is the continued bearishness in the United States 10-Year Bond futures.
The speculative position in the 10-Year has seen bearish bets increase for three straight weeks and by a total of -203,657 contracts over this period. This rising bearishness has pushed the 10-Year speculator standing to the most bearish level in the past one hundred and eight weeks, dating back to February 11th of 2020 when the speculator position totaled -398,919 net contracts.
The current 10-Year speculator strength index score underscores the weak speculator sentiment and shows an extreme-bearish reading with a 13.9 percent score this week. (The speculator strength index measures the current speculator standing compared to the past three years, where above 80 is extreme-bullish, below 20 is extreme-bearish).
The bond markets with higher speculator bets were Long US Bond (51,897 contracts), Fed Funds (1,134 contracts), United States 5-Year (21,898 contracts), and the Ultra U.S. Treasury Bond Futures (50,843 contracts). The markets with lower speculator bets were the United States 2-Year Bond (-1,919 contracts), Eurodollar Futures (-164,965 contracts), United States 10-Year Bond (-11,937 contracts), and the Ultra 10-Year U.S. Treasury Note Futures (-40,563 contracts).
3-Month Eurodollars Futures
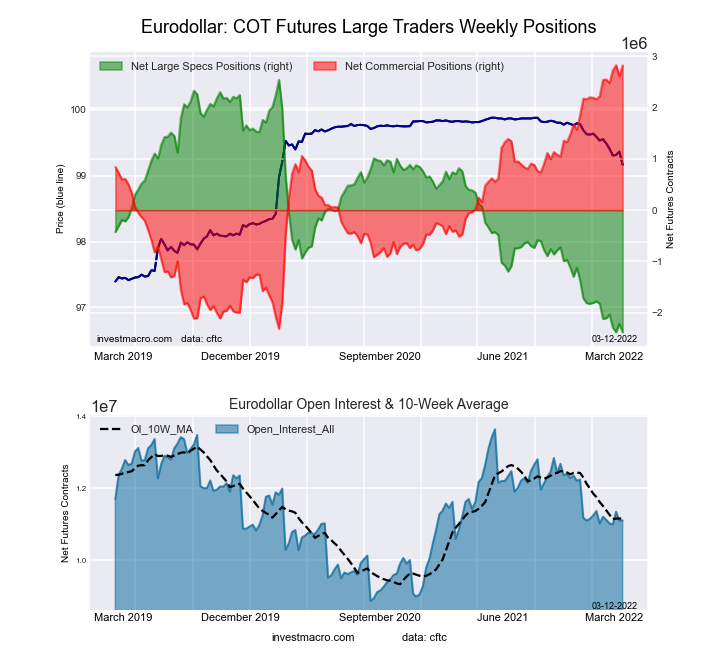
The 3-Month Eurodollars large speculator standing this week reached a net position of -2,384,696 contracts in the data reported through Tuesday. This was a weekly decline of -164,965 contracts from the previous week which had a total of -2,219,731 net contracts.
This week’s current strength score (the trader positioning range over the past three years, measured from 0 to 100) shows the speculators are currently Bearish-Extreme with a score of 0.0 percent. The commercials are Bullish-Extreme with a score of 99.9 percent and the small traders (not shown in chart) are Bearish-Extreme with a score of 7.7 percent.
30-Day Federal Funds Futures
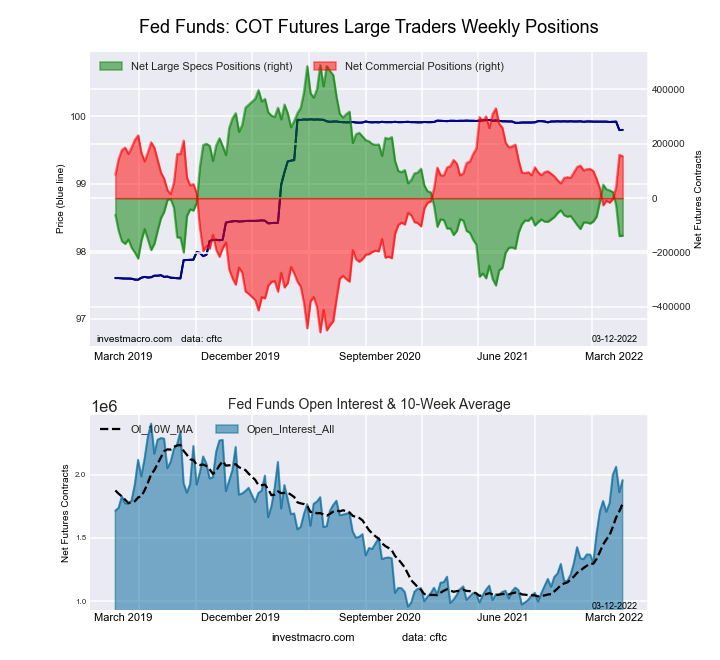
The 30-Day Federal Funds large speculator standing this week reached a net position of -138,138 contracts in the data reported through Tuesday. This was a weekly advance of 1,134 contracts from the previous week which had a total of -139,272 net contracts.
This week’s current strength score (the trader positioning range over the past three years, measured from 0 to 100) shows the speculators are currently Bearish with a score of 22.6 percent. The commercials are Bullish with a score of 78.6 percent and the small traders (not shown in chart) are Bearish with a score of 21.1 percent.
2-Year Treasury Note Futures
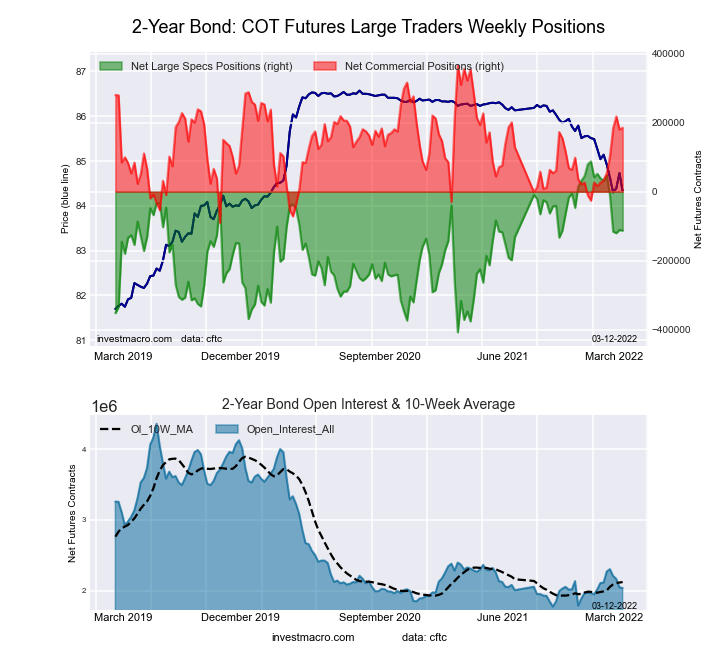
The 2-Year Treasury Note large speculator standing this week reached a net position of -112,746 contracts in the data reported through Tuesday. This was a weekly decrease of -1,919 contracts from the previous week which had a total of -110,827 net contracts.
This week’s current strength score (the trader positioning range over the past three years, measured from 0 to 100) shows the speculators are currently Bullish with a score of 59.5 percent. The commercials are Bullish with a score of 60.3 percent and the small traders (not shown in chart) are Bearish-Extreme with a score of 12.9 percent.
5-Year Treasury Note Futures

The 5-Year Treasury Note large speculator standing this week reached a net position of -452,141 contracts in the data reported through Tuesday. This was a weekly gain of 21,898 contracts from the previous week which had a total of -474,039 net contracts.
This week’s current strength score (the trader positioning range over the past three years, measured from 0 to 100) shows the speculators are currently Bearish-Extreme with a score of 3.8 percent. The commercials are Bullish-Extreme with a score of 100.0 percent and the small traders (not shown in chart) are Bearish-Extreme with a score of 9.9 percent.
10-Year Treasury Note Futures
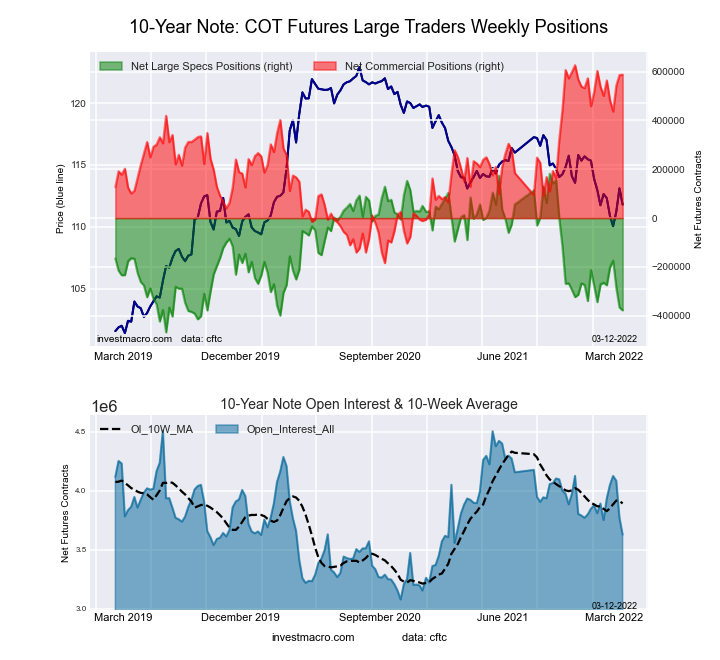
The 10-Year Treasury Note large speculator standing this week reached a net position of -377,720 contracts in the data reported through Tuesday. This was a weekly fall of -11,937 contracts from the previous week which had a total of -365,783 net contracts.
This week’s current strength score (the trader positioning range over the past three years, measured from 0 to 100) shows the speculators are currently Bearish-Extreme with a score of 13.9 percent. The commercials are Bullish-Extreme with a score of 95.2 percent and the small traders (not shown in chart) are Bearish with a score of 29.8 percent.
Ultra 10-Year Notes Futures
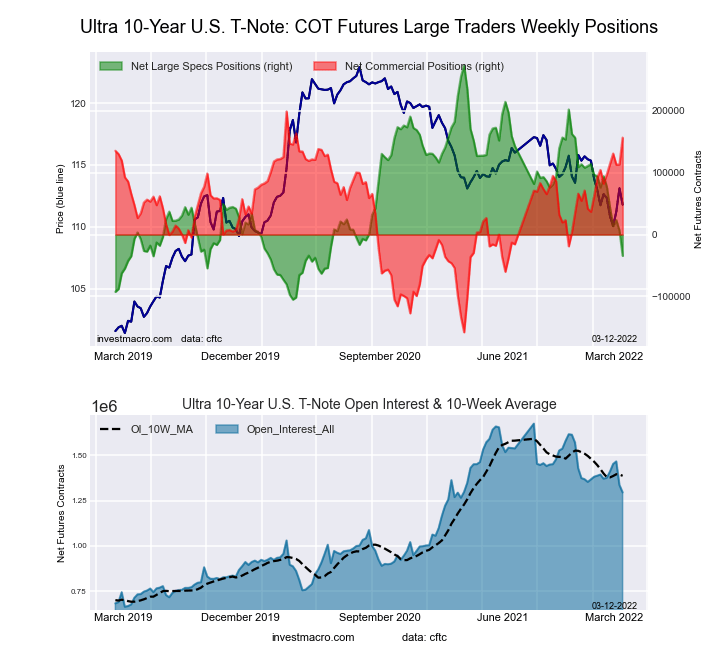
The Ultra 10-Year Notes large speculator standing this week reached a net position of -34,380 contracts in the data reported through Tuesday. This was a weekly fall of -40,563 contracts from the previous week which had a total of 6,183 net contracts.
This week’s current strength score (the trader positioning range over the past three years, measured from 0 to 100) shows the speculators are currently Bearish-Extreme with a score of 18.7 percent. The commercials are Bullish-Extreme with a score of 88.2 percent and the small traders (not shown in chart) are Bearish with a score of 41.9 percent.
US Treasury Bonds Futures
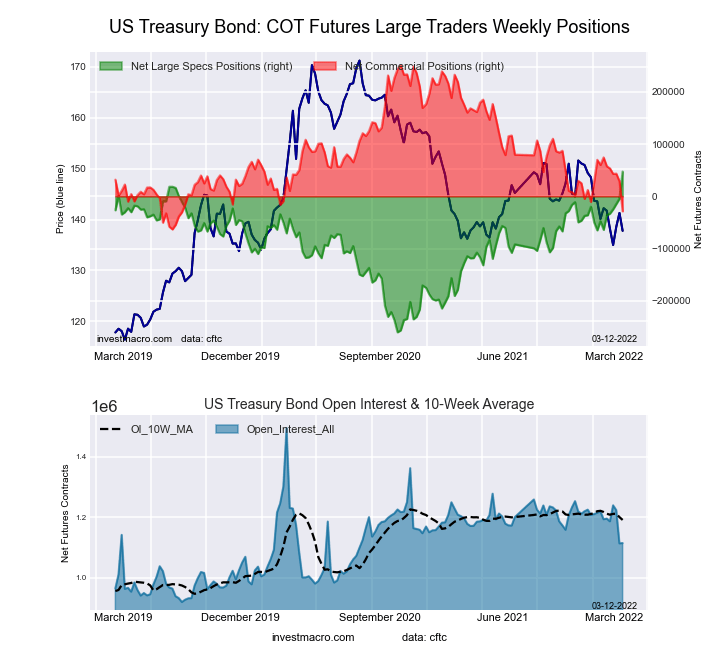
The US Treasury Bonds' large speculator standing this week reached a net position of 47,368 contracts in the data reported through Tuesday. This was a weekly rise of 51,897 contracts from the previous week which had a total of -4,529 net contracts.
This week’s current strength score (the trader positioning range over the past three years, measured from 0 to 100) shows the speculators are currently Bullish-Extreme with a score of 100.0 percent. The commercials are Bearish-Extreme with a score of 11.0 percent and the small traders (not shown in chart) are Bearish with a score of 37.7 percent.
Ultra US Treasury Bonds Futures
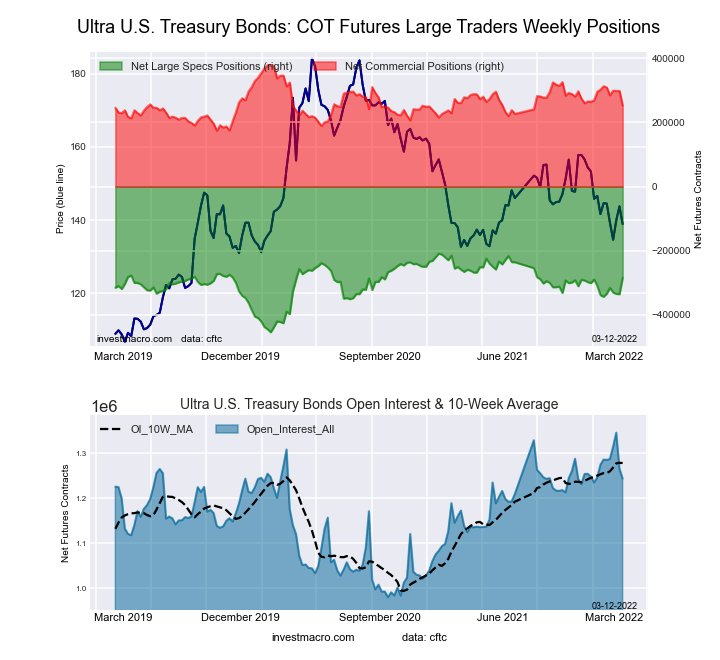
The Ultra US Treasury Bonds large speculator standing this week reached a net position of -284,418 contracts in the data reported through Tuesday. This was a weekly lift of 50,843 contracts from the previous week which had a total of -335,261 net contracts.
This week’s current strength score (the trader positioning range over the past three years, measured from 0 to 100) shows the speculators are currently Bullish with a score of 69.2 percent. The commercials are Bearish with a score of 38.5 percent and the small traders (not shown in chart) are Bullish with a score of 51.2 percent.