
Key Highlights For March 11, 2019
- The price of Bitcoin Cash (BCH) rose along an upward trend from Mar 9 to Mar 11.
- The price is trading inside a symmetrical triangle.
- The MACD and SMAs triggered a sell signal.
- There are resistance areas near $135 and $145.
- There are support areas near $120 and $110.
Finding Support
The price of BCH on Coinbase is analyzed at 30-minute intervals from Mar 5 to Mar 11.
BCH reached a low of $122.33 on Mar 5. At until Mar 11, the price reached a successfully higher low. Tracing these lows gives us the ascending support line.
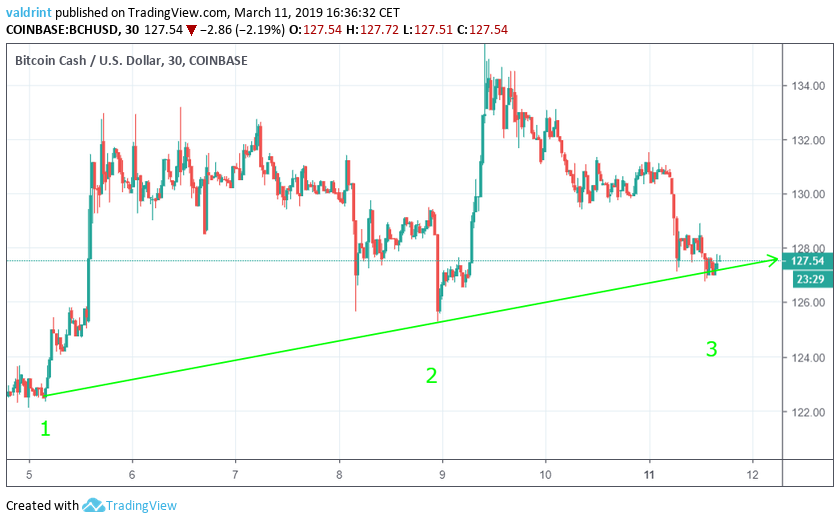
The dates on which the line was touched are Mar 5, 9, and 11.
The ascending support acts a floor through which price should not drop. It predicts the lower levels price might reach during a certain period of time. Between Mar 5 and 11, BCH has been trading at or above the rate of growth predicted by the support.
However recent price drops have brought BCH below the support. This could precipitate future drops; however, this cannot be currently determined. If the drop below support is maintained or grows larger, rapid price drops may occur. On the other hand, rise above the support might soon follow this most recent dip.
Future price fluctuations cannot be determined by this data alone; however, continued price drops by BCH from its price the time of writing should be construed as a possible sign of more rapid or sustained decreases to follow.
Symmetrical Triangle
After the Mar 9 low, the price launched a rapid upward move—rising from around $125 to a high of $135.50. Since that high was reached, price has dropped back to between $127 and $128 at the time of writing. During this fall, small market cycles occurred. Successively lower highs generate a descending resistance line.
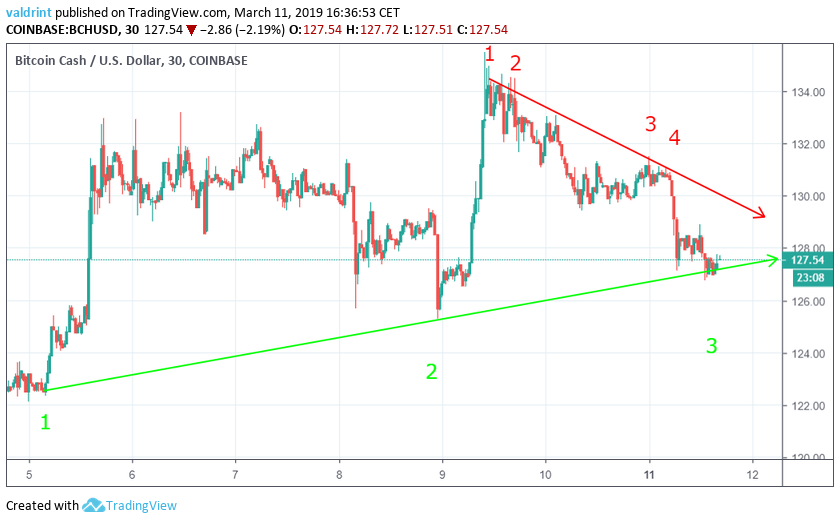
The dates on which the line was touched are Mar 9 (twice), 10, and 11.
The resistance and support lines combine to create a symmetrical triangle. It is likely that the current dip is a natural response to the Mar 9 price spike. Prices are now trading at around the support.
Prices may rise from their current level and move toward the resistance as part of a normal market cycle. After returning inside the triangle, it is likely that prices will continue trading there until convergence of the resistance and support lines force a breakout or breakdown.
Given the current market movement, the price of BCH is likely to trade inside the triangle until a point of convergence occurs. Then, it would be forced to breakout or breakdown. Given the current movements, a breakdown seems more likely; however, if a rise follows in the next several days a breakout, this may change.
The sharp price rejections by the resistance line could mean that the market is not yet ready for higher prices, and more consolidation is in store. The creation of a neutral pattern further validates the hypothesis.
Start Of A Downtrend?
The moving average convergence divergence (MACD) is a trend indicator that shows the relationship between two moving averages (long and short-term) and the price. It is used to measure the strength of a move.
Combined with simple moving averages (SMA), MACD can be used as a trigger for buy and sell signals. Signals are triggered whenever the MACD line is above 0 and the price is above the 21 (red) and 50-period (green) SMAs.
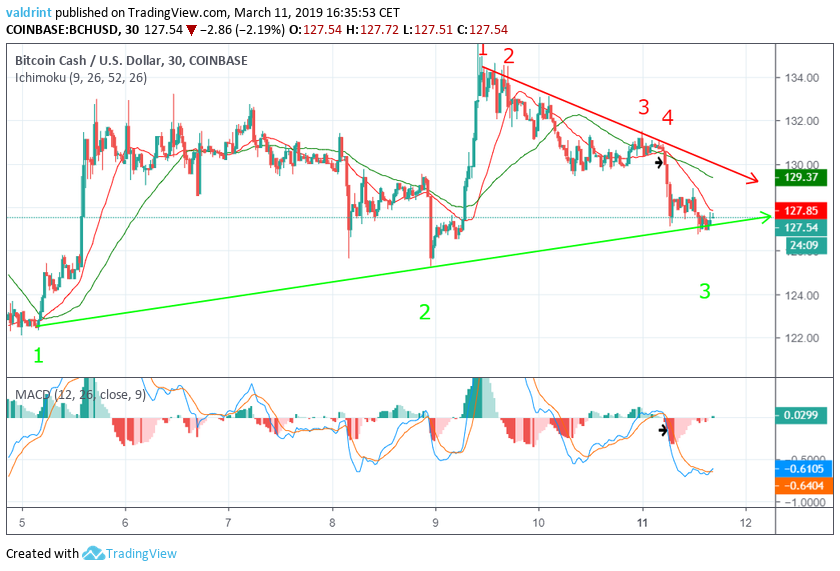
On Mar 11, a rapid downward move dropped the price below the 21 and 50-period moving averages. During the same interval, the MACD line crossed below 0. This would have triggered a sell signal, indicating that the current trend may be over and a downtrend may be about to begin.
Using these indicators, an upcoming correction in price for BCH appears likely. Ths current drop in price may mark the beginning of this correction. However, if a rise precedes a return to the triangle, the correction may be postponed for an indeterminate period.
Future Movement
The price of BCH on Coinbase is analyzed at six-hour intervals from Jan 10 to Mar 11.
Resistance and support areas are formed when the price reaches a certain level several times. They can act as a ceiling/floor that prevents the price from moving further in that direction.
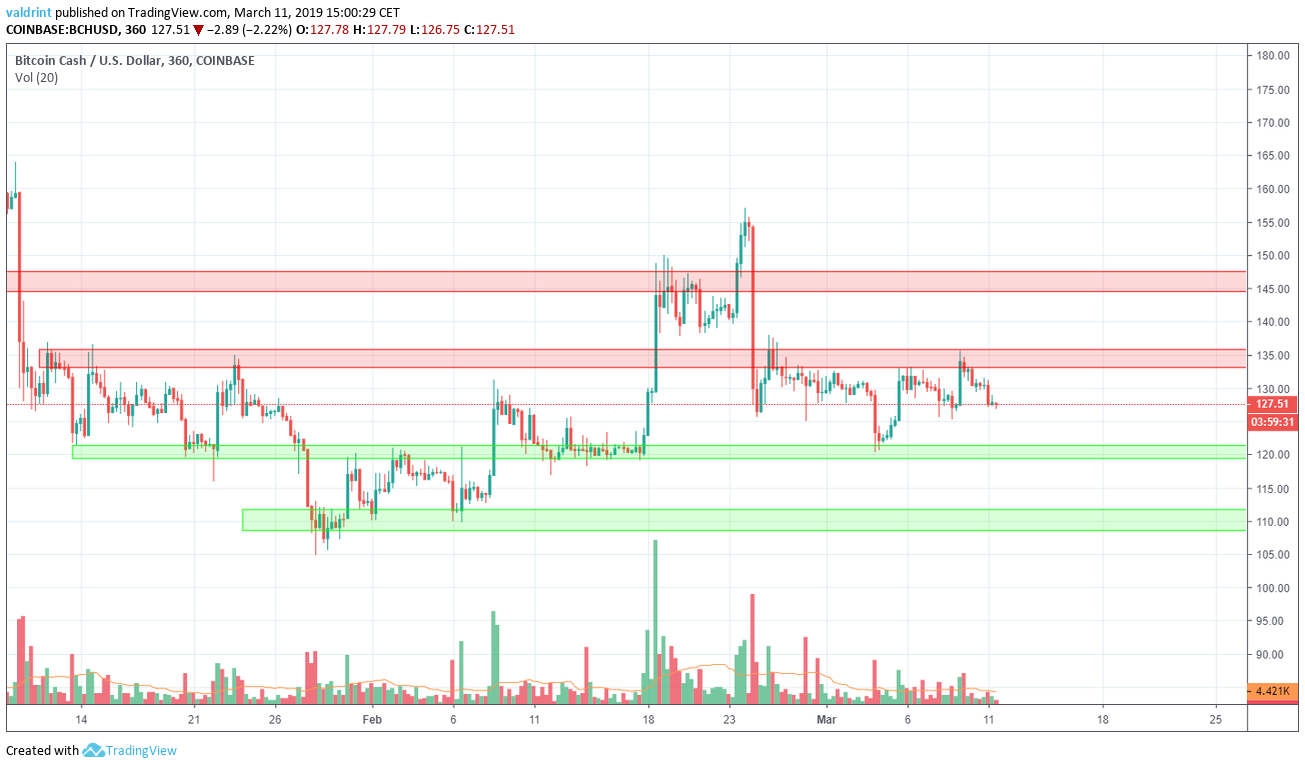
The first resistance area is found near $135, followed by the second one near $145. If price were to break out of the triangle, these would be likely reversal areas.
The first support area is found near $120, followed by the second on near $110. If the price were to breakdown from the triangle, these would be likely support areas. A bounce-back could be expected before price were to reach these areas, especially the $110 level.
Final Analysis:
Based on this analysis, the price of BCH is likely to trade inside the symmetrical triangle without experiencing significant volatility, before potentially breaking down. If the price stays inside the confines of the triangle, this prediction may be partially validated. If it breaks down, the prediction will be fully validated.
Disclaimer: This article is not trading advice and should not be construed as such. Always consult a trained financial professional before investing in cryptocurrencies, as the market is particularly volatile.