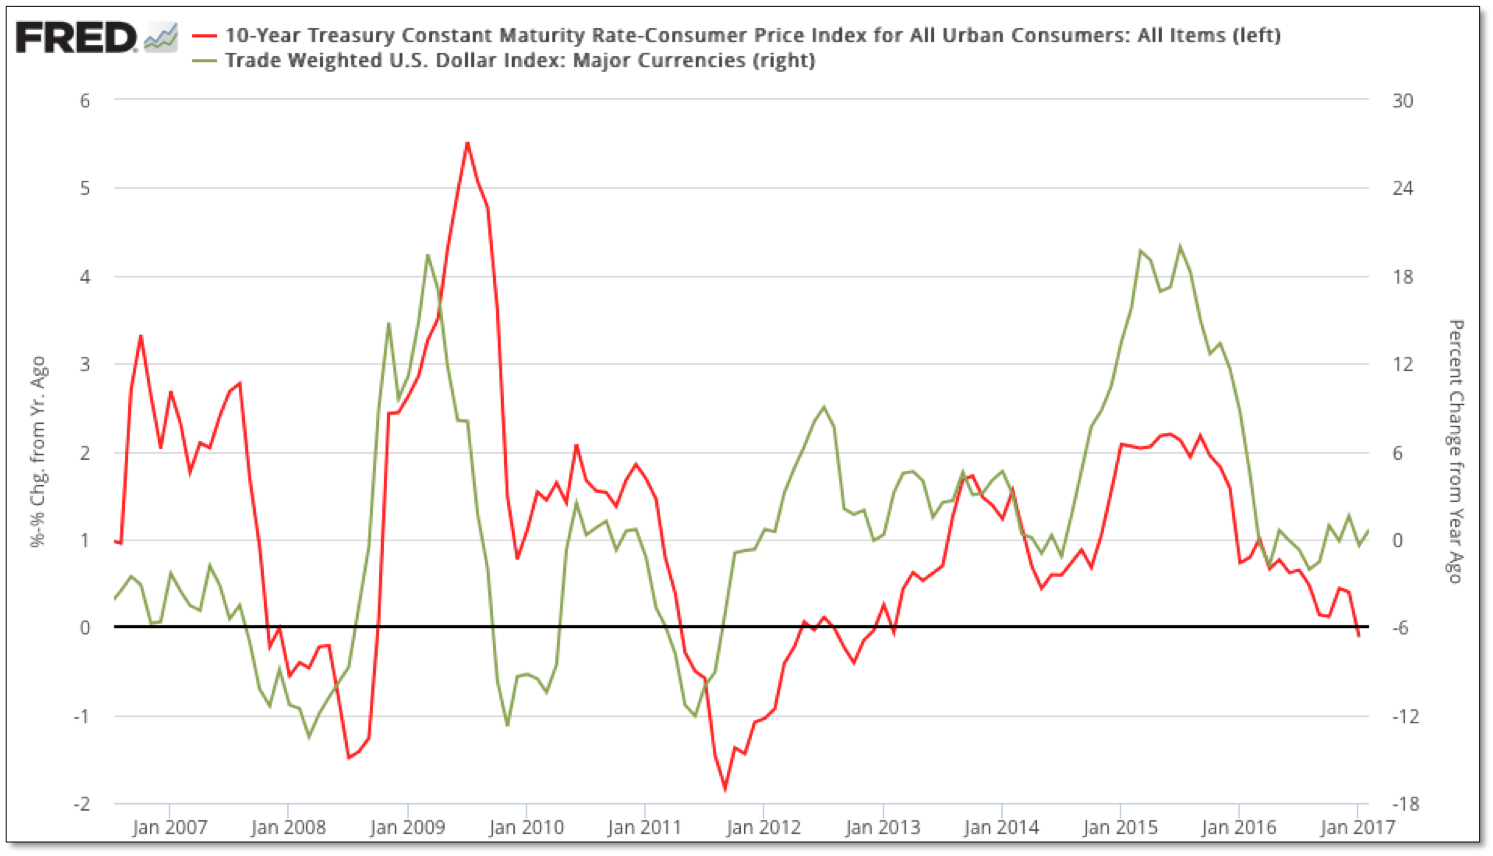
Released Wednesday morning, the CPI report for January indicated that prices for goods and services rose by the most in 4 years. On a year over year basis, the consumer price index rose 2.5 percent, its biggest gain in 5 years. Although equities have so far managed to shrug off any inflationary concerns to date, the rubber appears to be getting very close to meeting the proverbial road when it comes to the negative impacts of higher realized inflation – which is difficult to square in any positive light for stocks, especially the red hot financial sector, as creditors become adversely impacted through lower real yields.
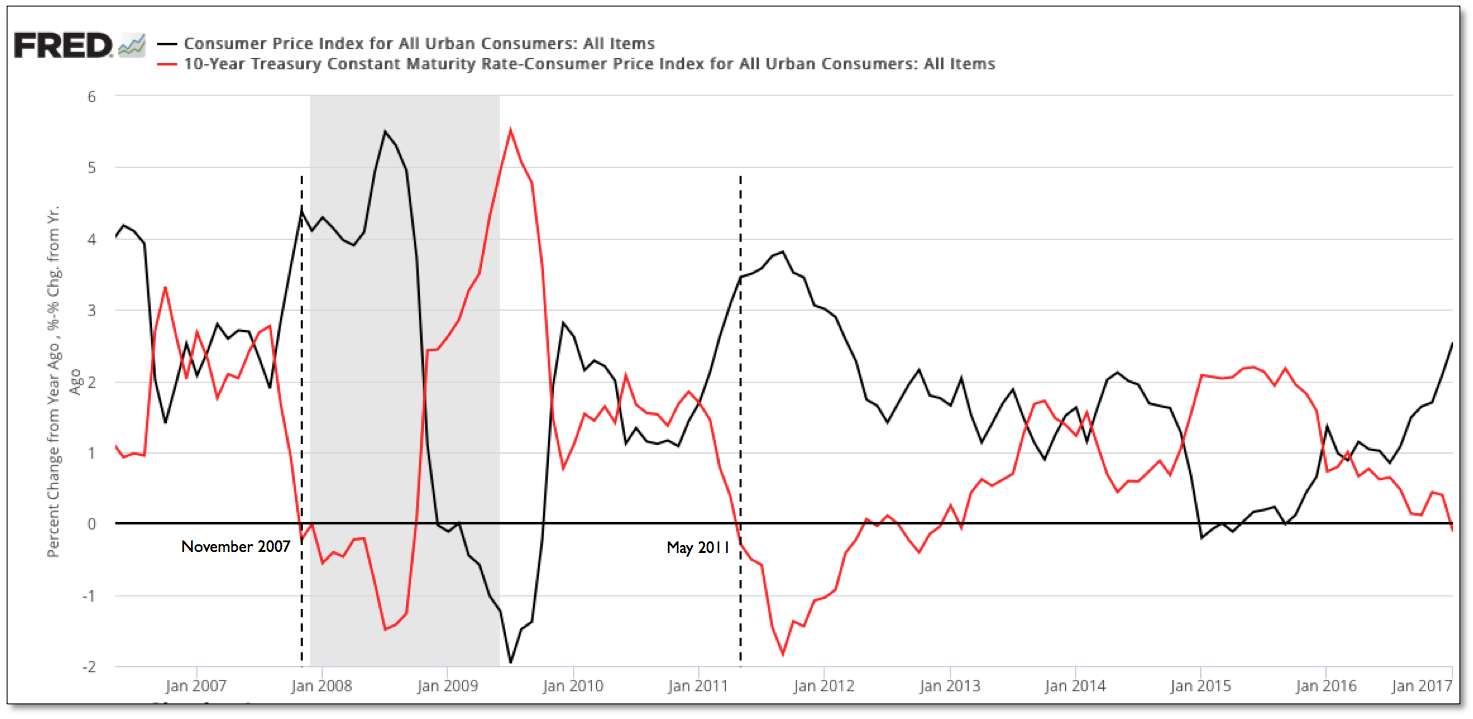
In fact, with the latest CPI data, the 10-year real yield went negative for the first time (on a downside trend) since May 2011; with the next previous occasion in November 2007 – both times not exactly prudent spots to own stocks. Although the inflation data would also appear to negatively affect the performance of Treasuries going forward, we do suspect they will find some shelter, as they have in the past when equities turn down and as the economic data softens.
Moreover, as shown below, juxtaposed with the year-over-year growth in payrolls, real yields have often led the broader trend in the economy, with the most recent streak of decent economic data likely serving as another high-water mark on the backside of a very mature economic expansion.
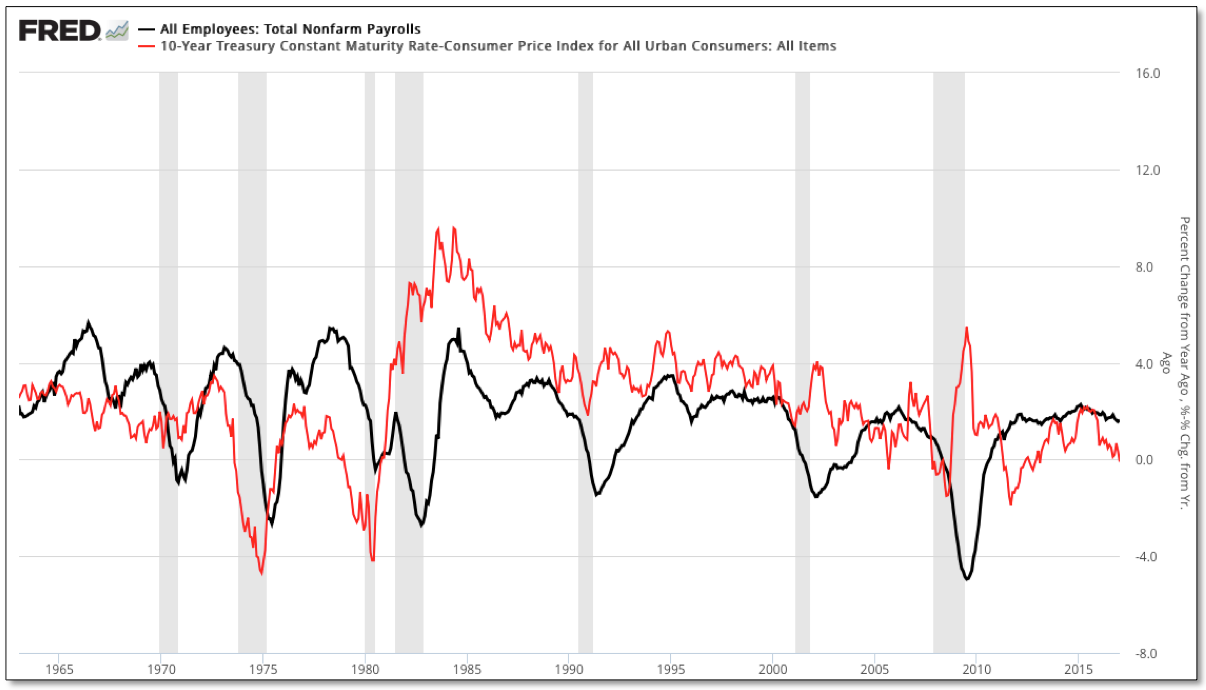
With so much attention focused on the sharp spike in yields since this past summer, our counter intuitive suspicion that real yields would still continue to fall as rising inflation outstrips the reach of nominal yields, appears to be playing out. Consequently, our sustained interest in precious metals, which exhibit a strong inverse correlation with real yields, should once again outperform.
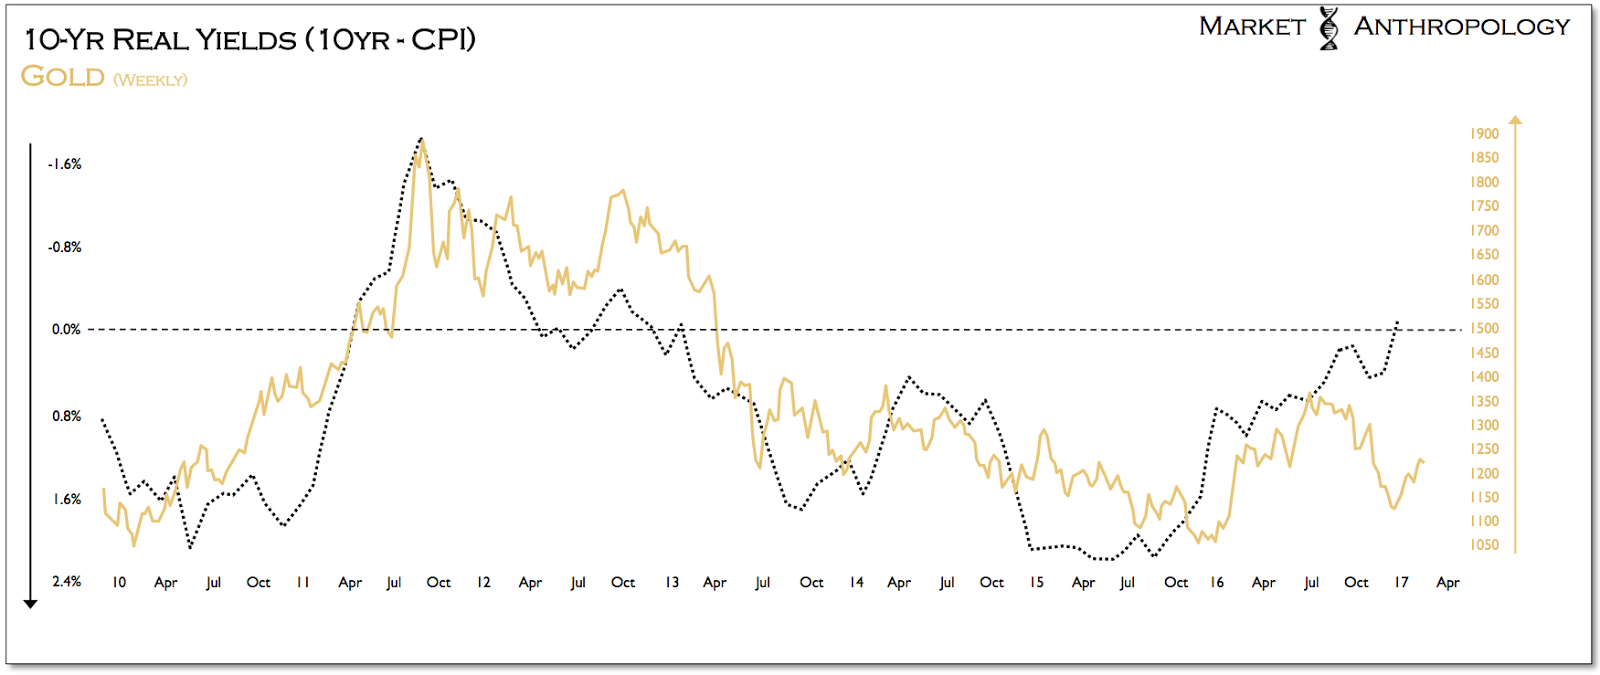
Although it wouldn't surprise us to see the most recent pause in gold cut deeper over the near-term as the inflation data might roil more hawkish expectations with the Fed, we view the move lower in real yields as largely symptomatic of underlying fatigue in the economy – which we don't believe will leave the Fed much capacity to tighten as markets extend through the year. As such, we expect a powerful push higher in precious metals will eventually reflect the breakdown in real yields that has largely been overlooked as equities make new highs.
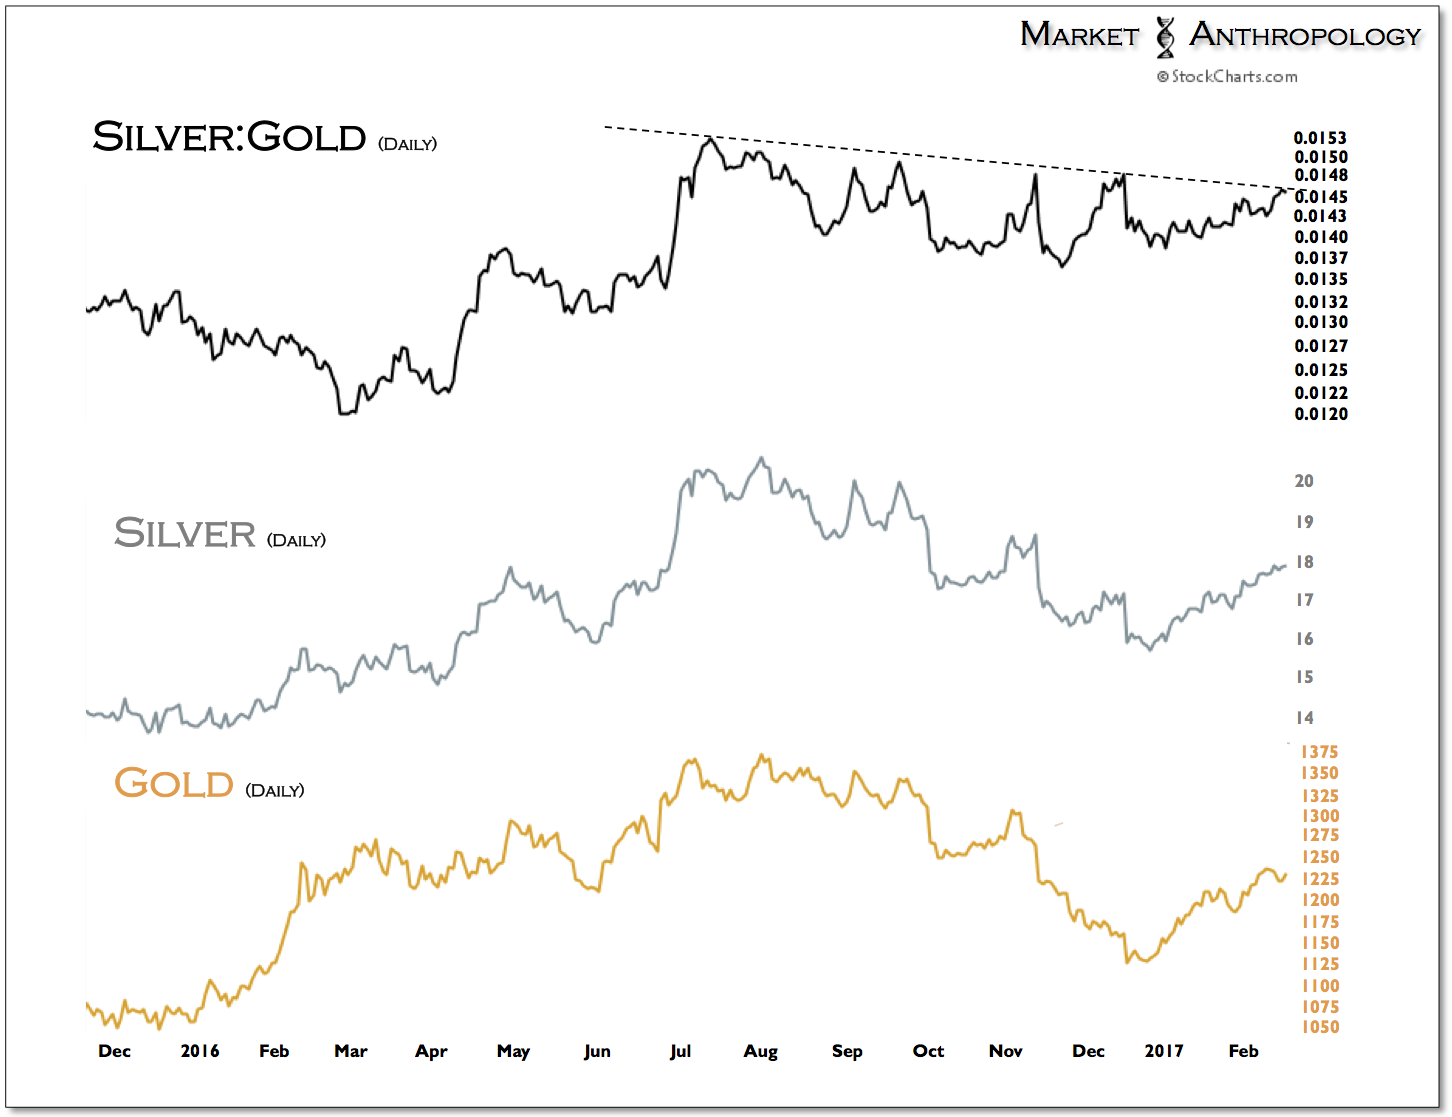
The silver:gold ratio, that we follow as a barometer of risk appetites within the precious metals sector, and which in the past has led inflationary trends, is now butting up against overhead resistance from the broader retracement decline that began last summer. While our expectations remain that silver will lead and outperform within the sector, the market may need to digest the recent gains since December before breaking through overhead resistance.
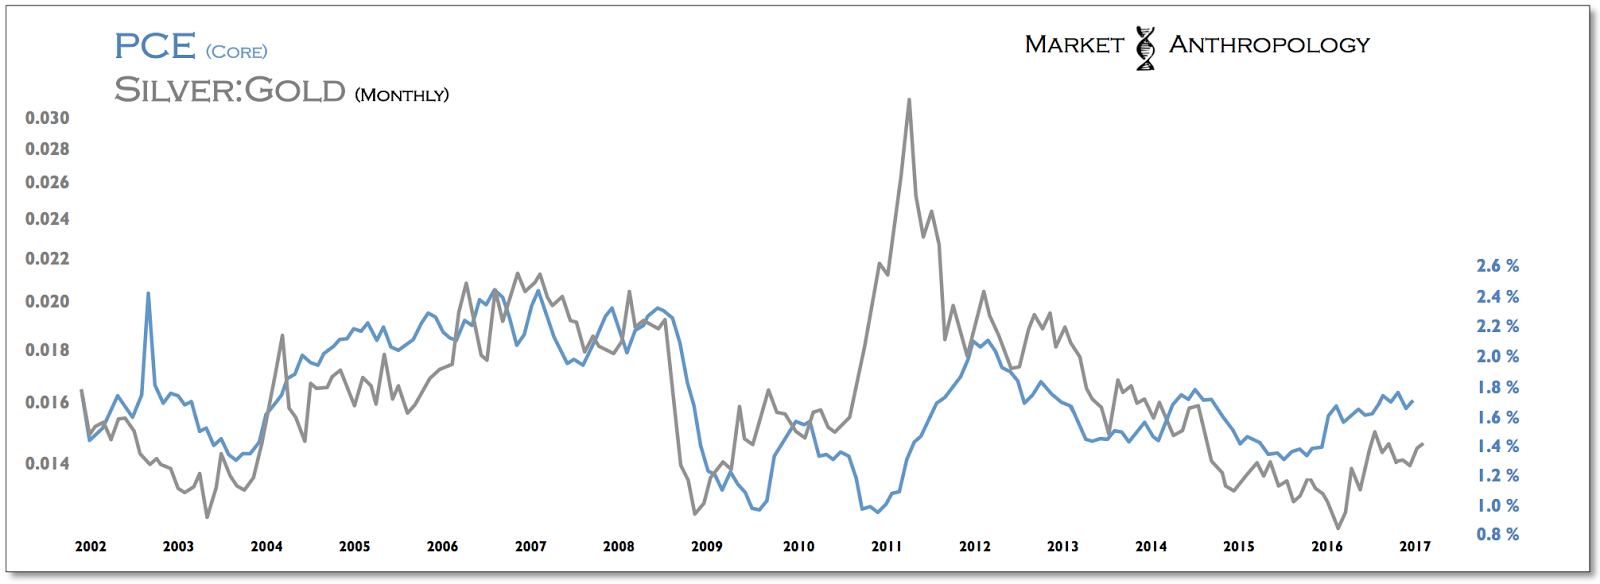
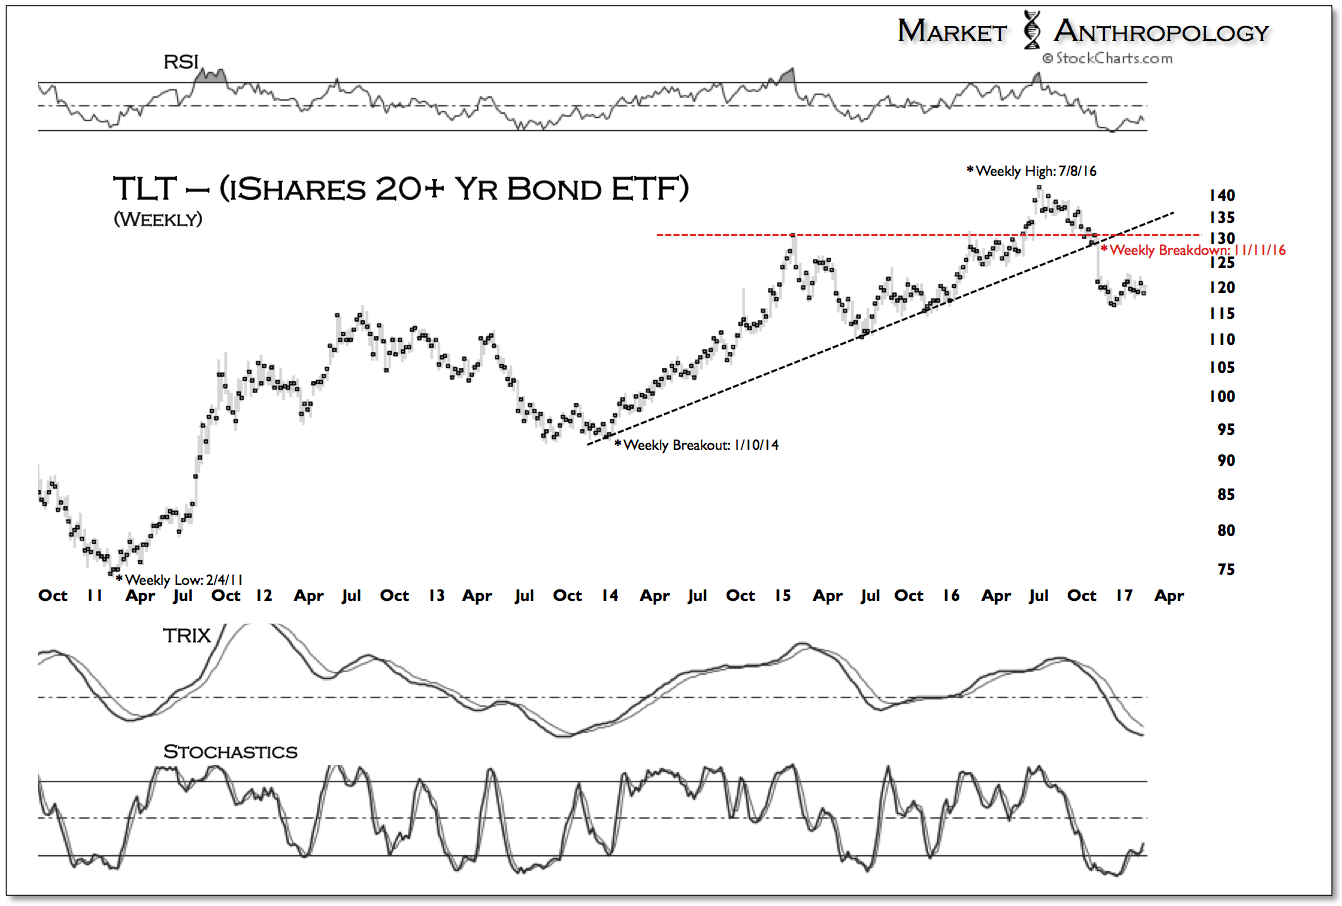
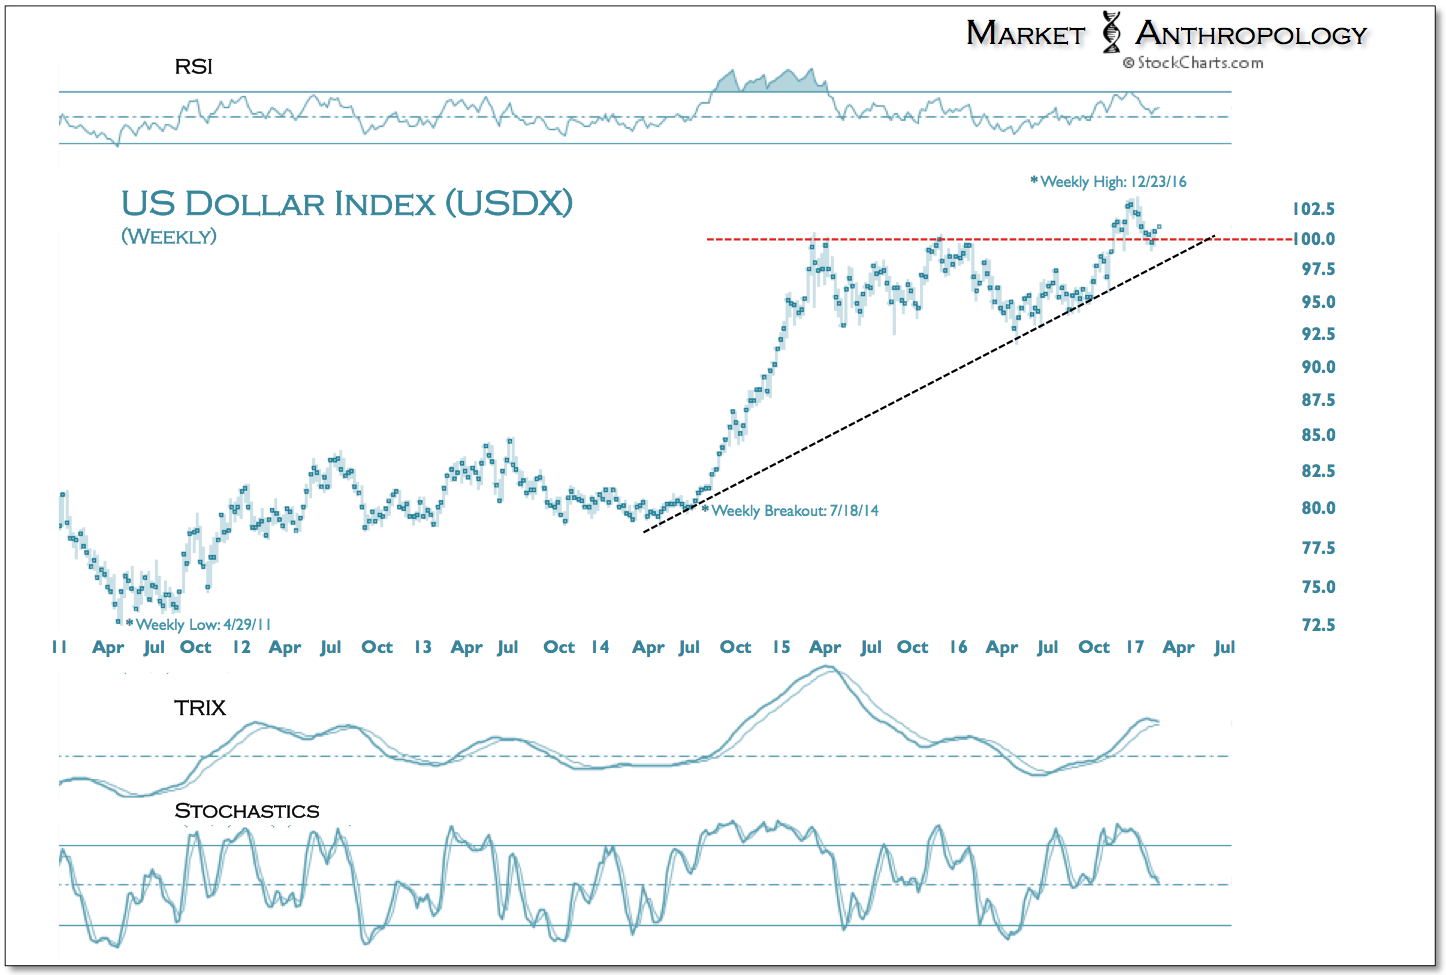
Greasing the wheels and facilitating the move lower in real yields to what we expect will break the previous lows from 2011, is 1) the US dollar that remains stretched near a cyclical high and poised to weaken; and 2) the secular trough in nominal yields, which from our read of historic long-term cycles (most recently, here and here) has limited upside reach.
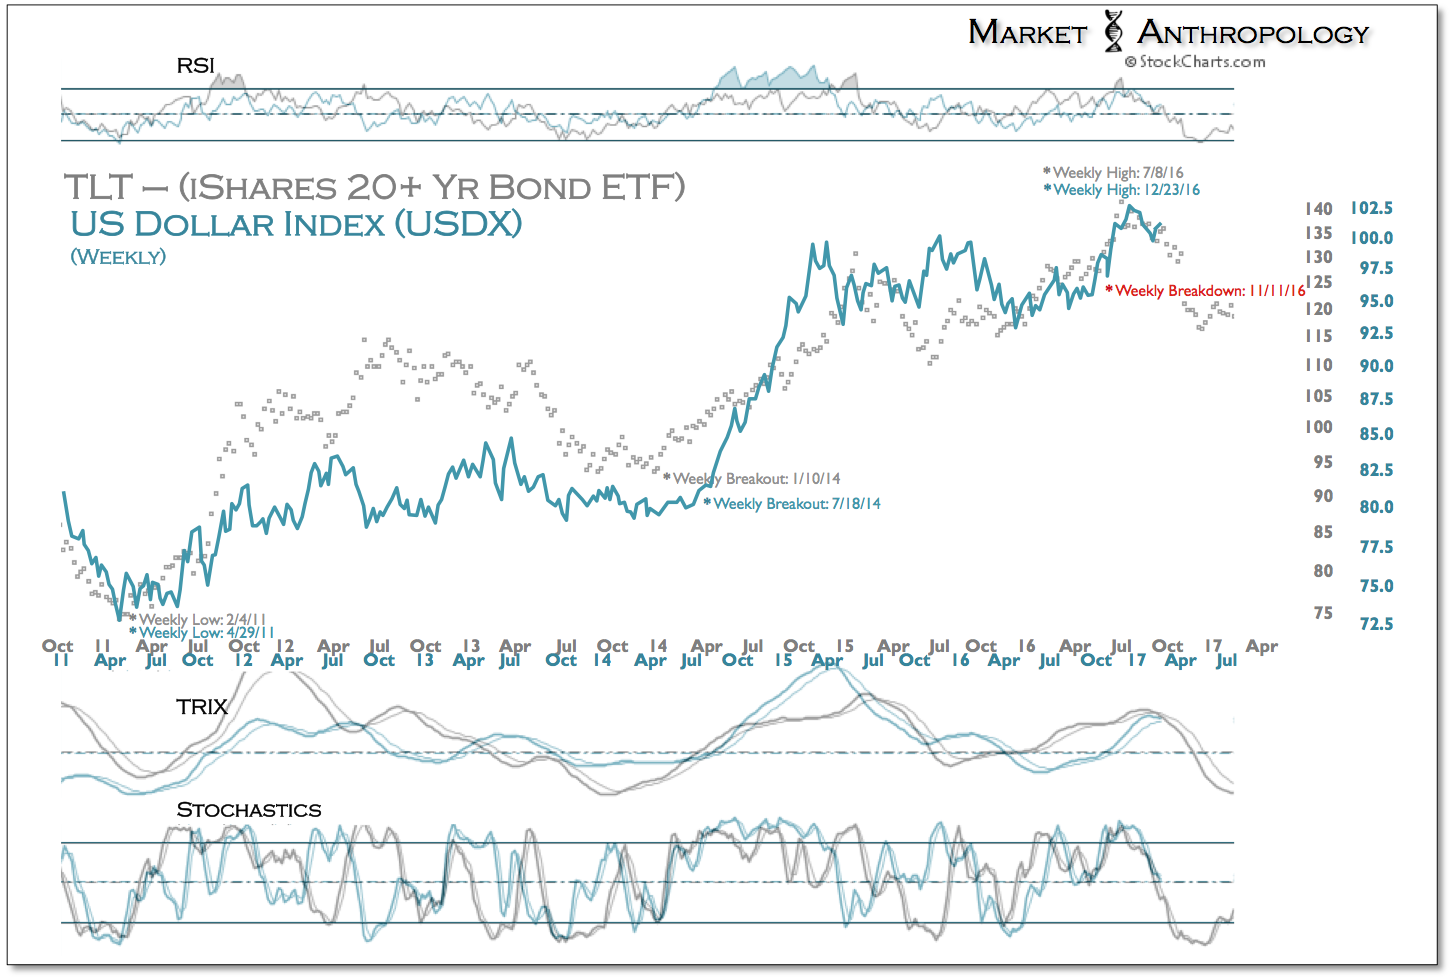
Over the past two years, the US dollar index has exhibited a strengthening inverse correlation with long-term Treasuries and gold (currently -0.89 and -0.90, respectively over 20 week rolling period) and naturally a positive correlation (0.90) with the 10-year yield. In fact, the last time long-term Treasuries and the dollar expressed such a strong relationship was in Q4 2001, directly before the US dollar index turned down from a cyclical peak.
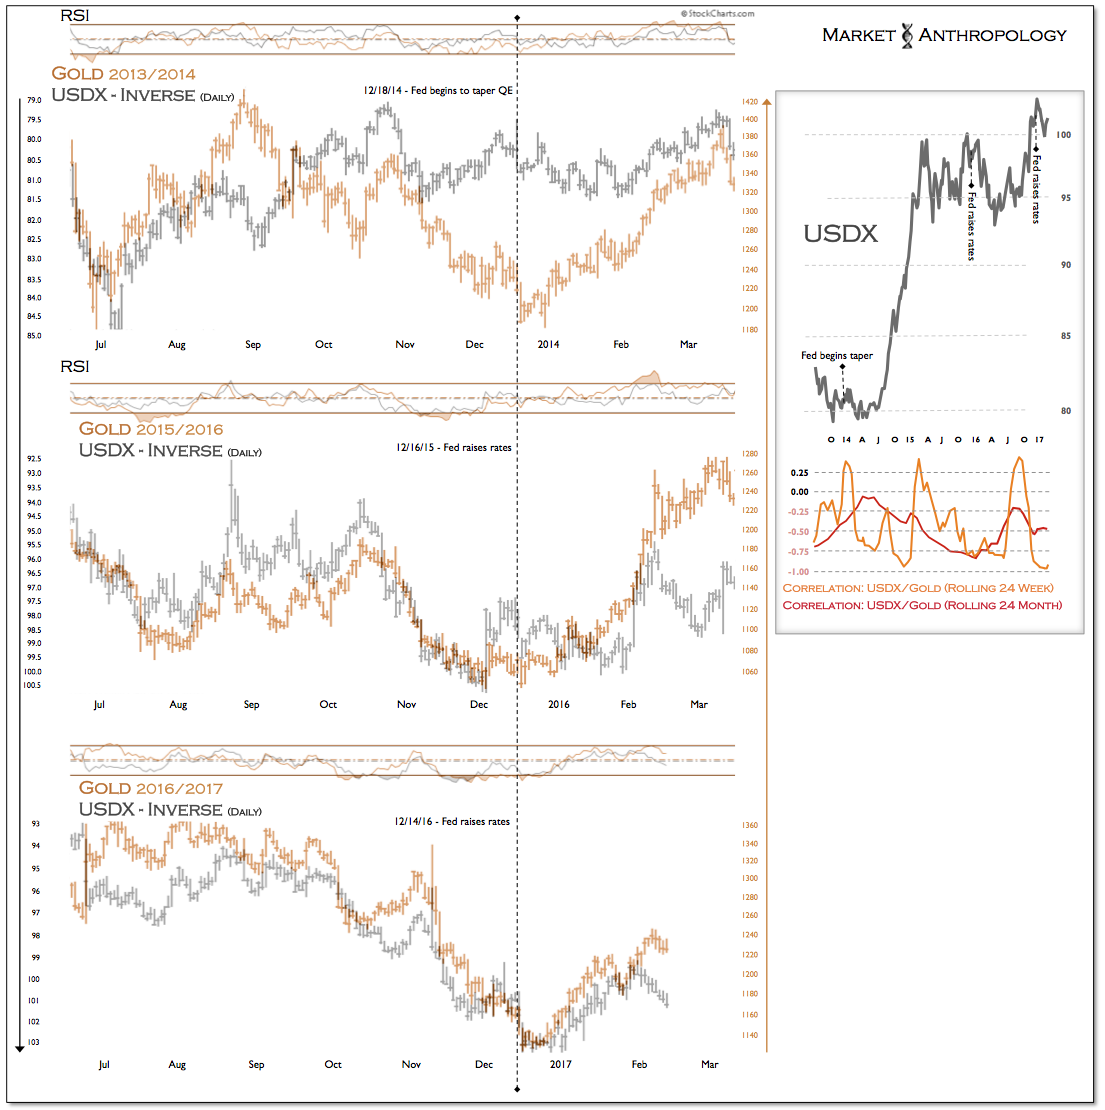
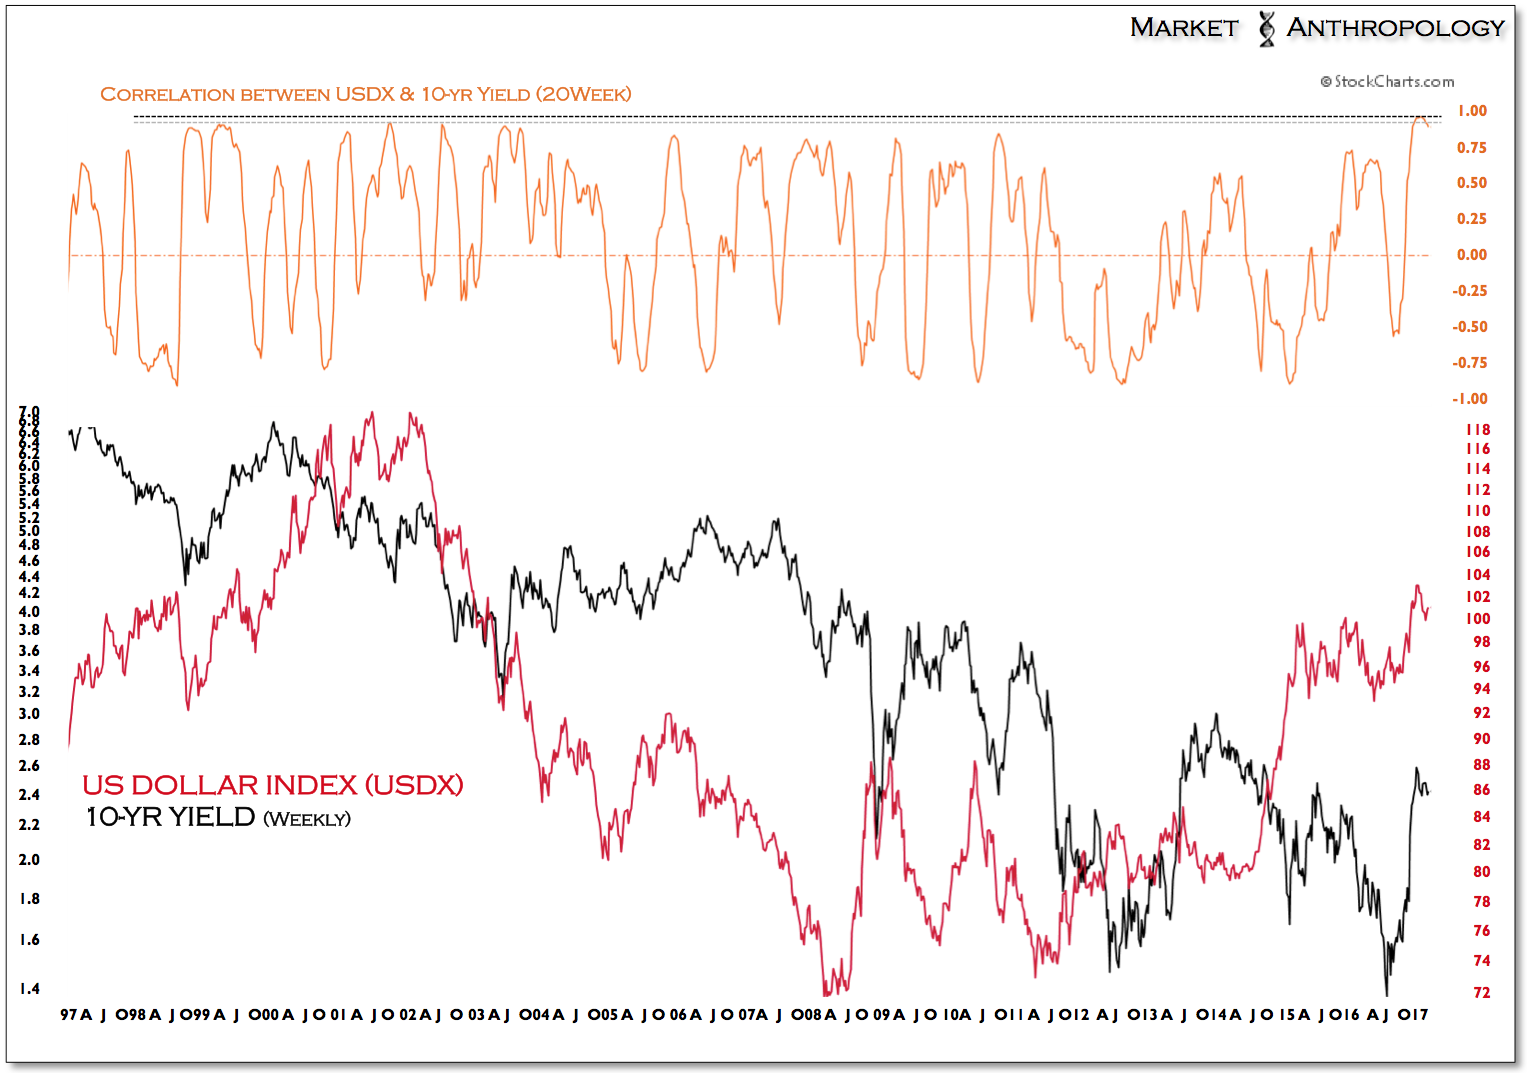
From a big-picture perspective, we’ve pointed out in the past that the dollar has followed major upside exhaustion extremes in long-term yields by 2 to 3 years. The 9/81’ secular high in yields was followed by a secular high in the US dollar index in 2/85’ (monthly). The upside exhaustion in yields in 1/00’ was followed by the cyclical high in the dollar index in 1/02’.
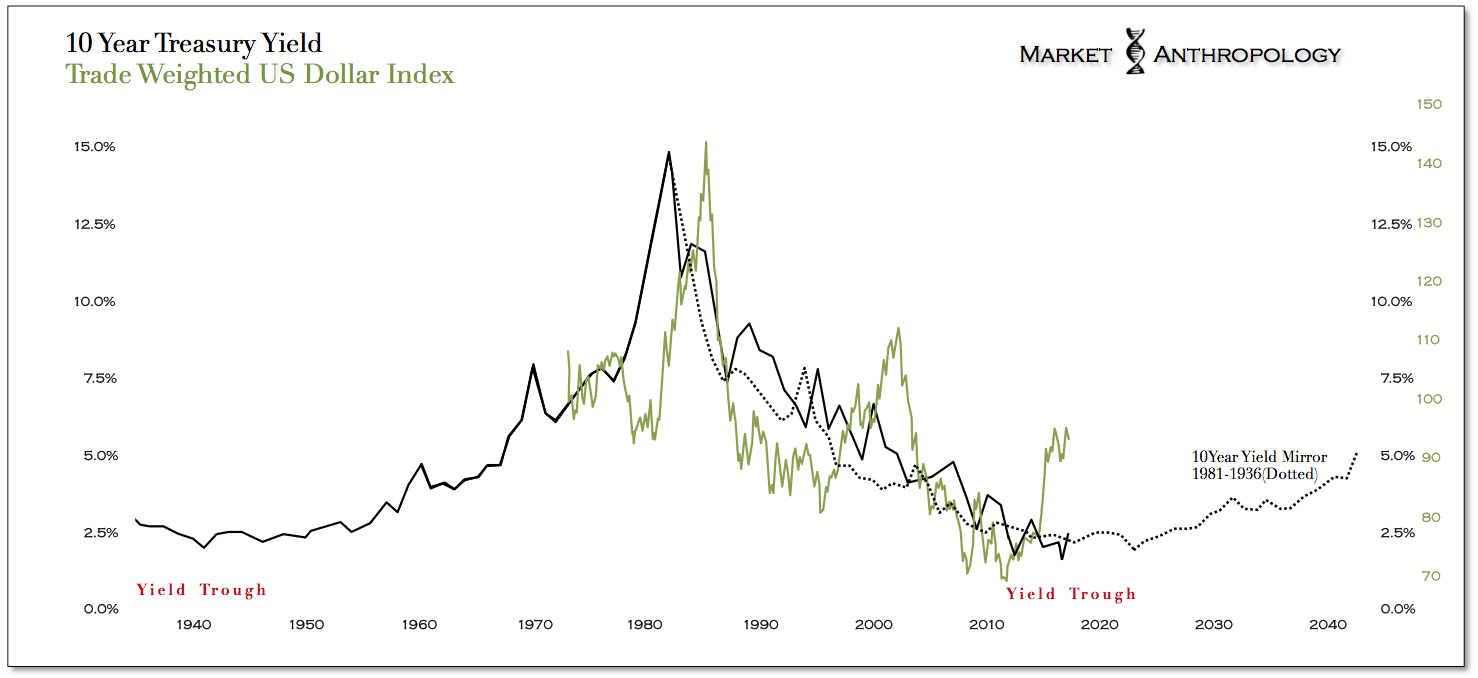
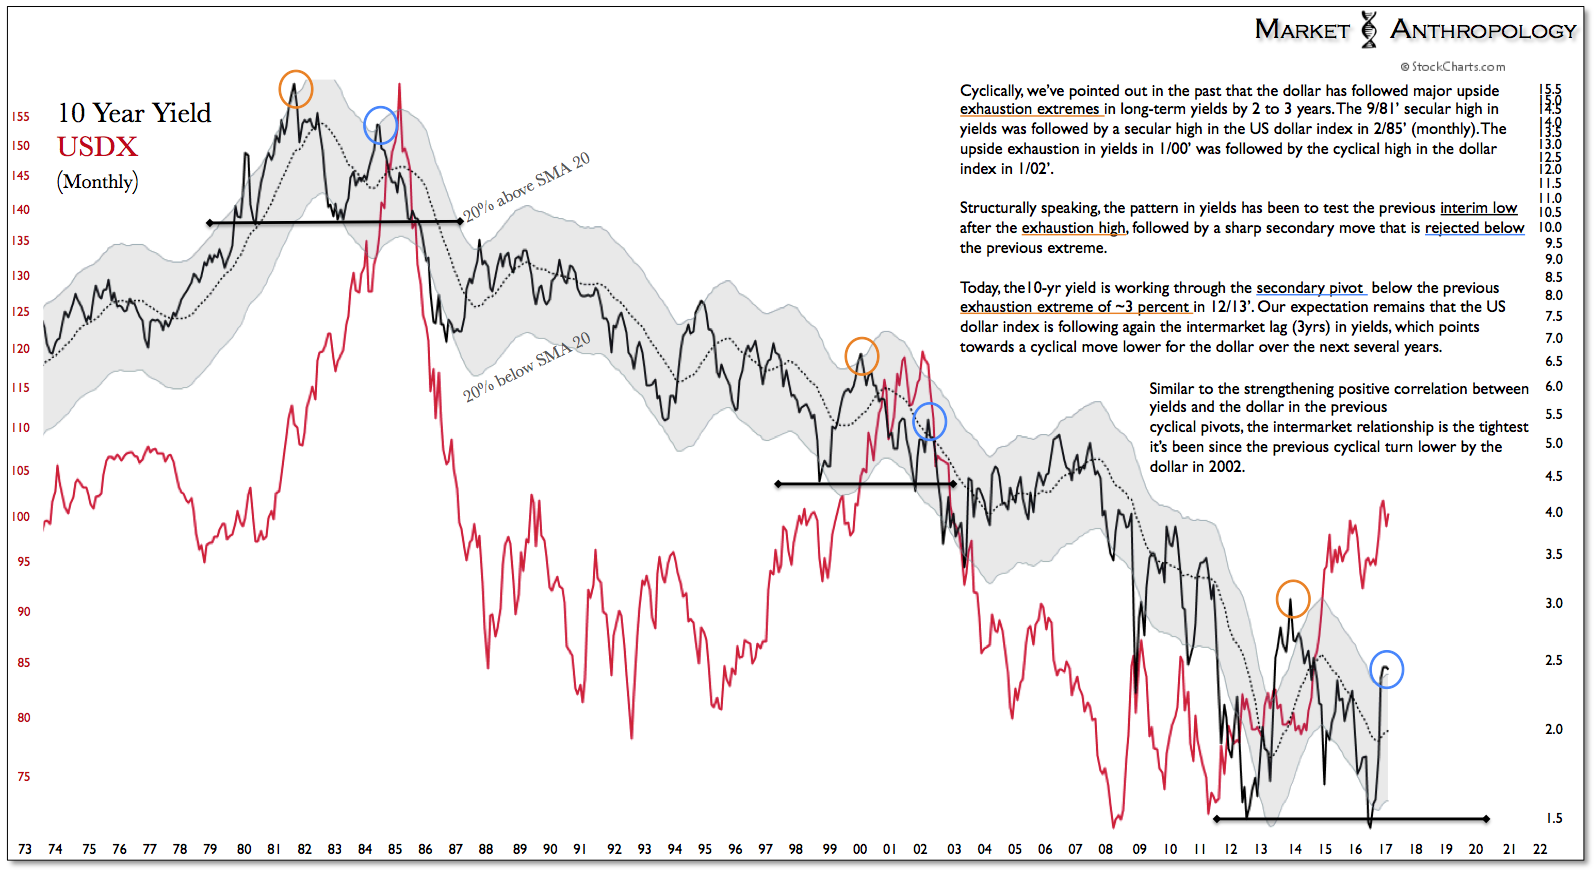
Structurally speaking, the pattern in yields has been to test the previous interim low after the exhaustion high, followed by a sharp secondary move that is rejected below the previous extreme.
Today, the 10-year yield is working through the secondary pivot below the previous exhaustion extreme of ~3 percent in 12/13’. Our expectation remains that the US dollar index is following again the long intermarket lag (3years) in yields, which points towards a cyclical move lower for the dollar over the next several years.
We have also pointed out in previous notes over the past few years, that over the intermediate-term, the dollar has followed the structural breaks in long-term Treasuries by several weeks. Resembling the throw-over top breakdown in long-term Treasuries last summer, the US dollar index appears to be working towards a breakdown of its own along similar folds, despite the markets attention with new highs.
