Oil prices fell from nine-month highs last week and have extended losses into this week, as escalating tensions between the US and Iran subsided. Gold also fell as safe-haven plays were scaled back, while agricultural commodities are higher, awaiting the signing of phase one of the US-China trade deal tomorrow.
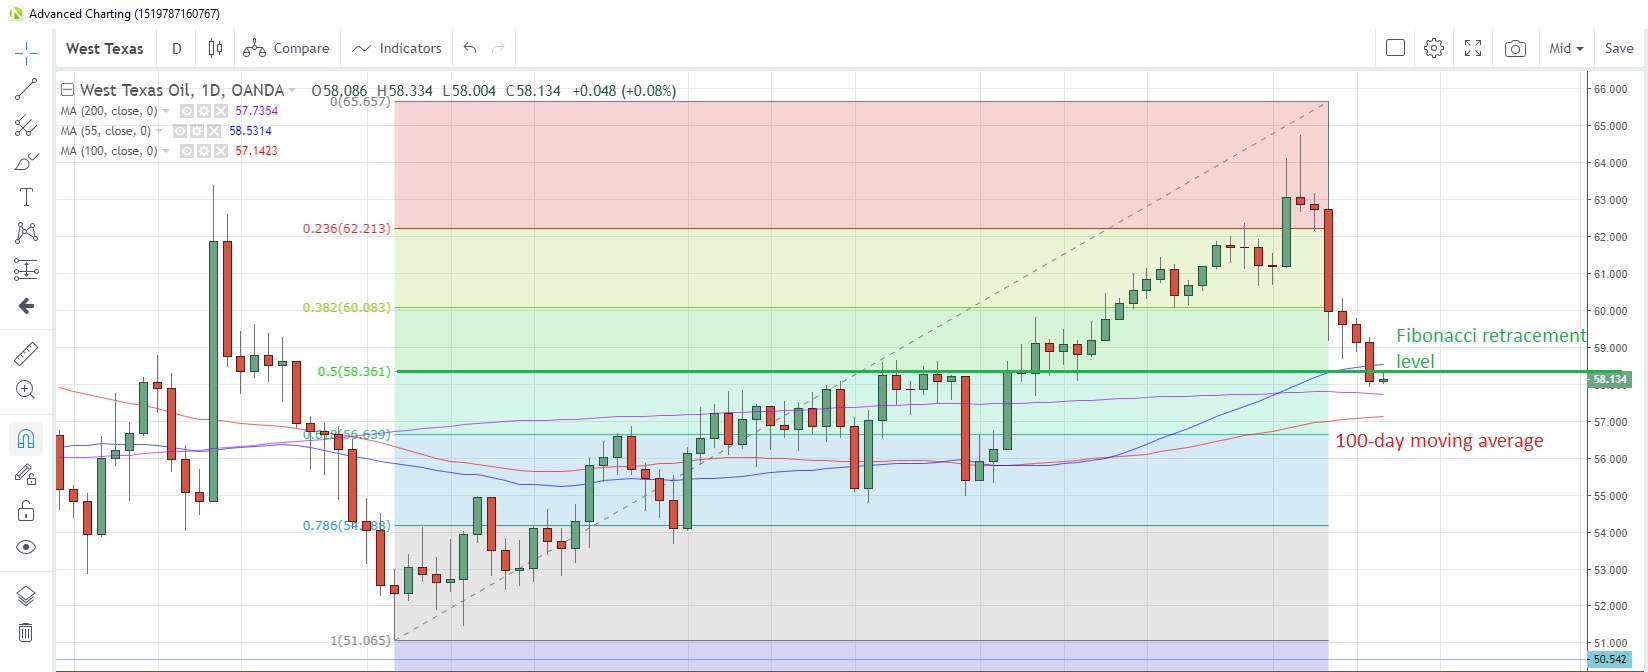
WTI Daily Chart

Energy
CRUDE OIL prices have fallen for the past six sessions as the threat of escalating retaliation attacks in the Middle East appear to have disappeared. Last week saw the biggest weekly drop since mid-July for West Texas Intermediate (WTI), which touched the lowest level since December 6 yesterday.
Saudi Arabia has vowed to maintain stable oil markets and we are due to hear the demand outlooks for 2020 from three institutions over the next three days: OPEC, the International Energy Agency and the Energy Information Administration. China is scheduled to release its oil output data on January 17. On the US supply front, the number of US oil rigs in production fell for a third week last week, dropping to the lowest since March 2017.
Speculative investors remain bullish on the prospects for oil, having increased net longs for a fifth straight week to January 7, according to the latest data from CFTC. Net longs are now at the highest since August 2018.
WTI opened below the 50% retracement level of the rally from October to January at $58.36 this morning, the first time it has done so since December 6. The 100-day moving average is at $57.14 and has supported prices for six weeks.
NATURAL GAS fell for the first time in six days yesterday, which came on the back of the largest weekly advance in nine weeks last week. Investors are assessing whether the frigid temperatures that are currently hitting the Northern US, the reason behind the recent rally, will continue.Natural gas inventories fell by 44 billion cubic feet in the week to January 3, less than the 58 billion expected and a reduction from the previous week’s 58 billion.
Precious metals
GOLD prices also succumbed to the better risk appetite after the apparent cessation of hostilities with Iran. Gold looks poised to fall for the first time in six weeks this week, barring any new flare up in the Middle East, bringing the longest rising streak since June to an end.
Speculative investors also pared back long positions, turning net sellers for the first time in four weeks in the week to January 7, CFTC data show.
SILVER has echoed gold’s movements, dropping this week for the first time in six weeks. The gold/silver (Mint) ratio has been relatively stable for the past week, capped on a closing basis by the 200-day moving average at 86.797 since December 17.
Speculative investors were net sellers of silver for the first time in four weeks to January 7, pulling net long positions from 28-month highs.
PALLADIUM had another push to record highs last week, posting the biggest weekly gain since June in the process. Investors are still focusing on stretched supply versus anticipated rising demand as the automotive industry pushes toward greener emissions, notably in China. Speculative investors are still enthusiastic about palladium’s prospects as they were net buyers for a second straight week to January 7, according to CFTC.
PLATINUM looks set to slide for a second consecutive day today amid some mild profit-taking on long positions. The prospects still look rosy however, according to speculative accounts’ positioning. Speculators increased their net long positions for an eighth straight week in the week to January 7, according to the latest report from CFTC, though the magnitude of those additions slumped to just 118 contracts (worth 11,800 troy ounces).
Base metals
COPPER prices jumped the most since December 6 yesterday after China’s exclusion from the US currency manipulator report paved the way for an unobstructed signing of the Phase one US-China trade deal tomorrow. The bounce caught some speculative investors unawares as they had turned net sellers for the first time in three weeks in the week to January 7, CFTC data showed.
A recent Bloomberg survey concluded that copper might maintain a bid bias through 2020 as capital spending for new production slows and stockpiles see drawdowns as US-China trade tensions ease.
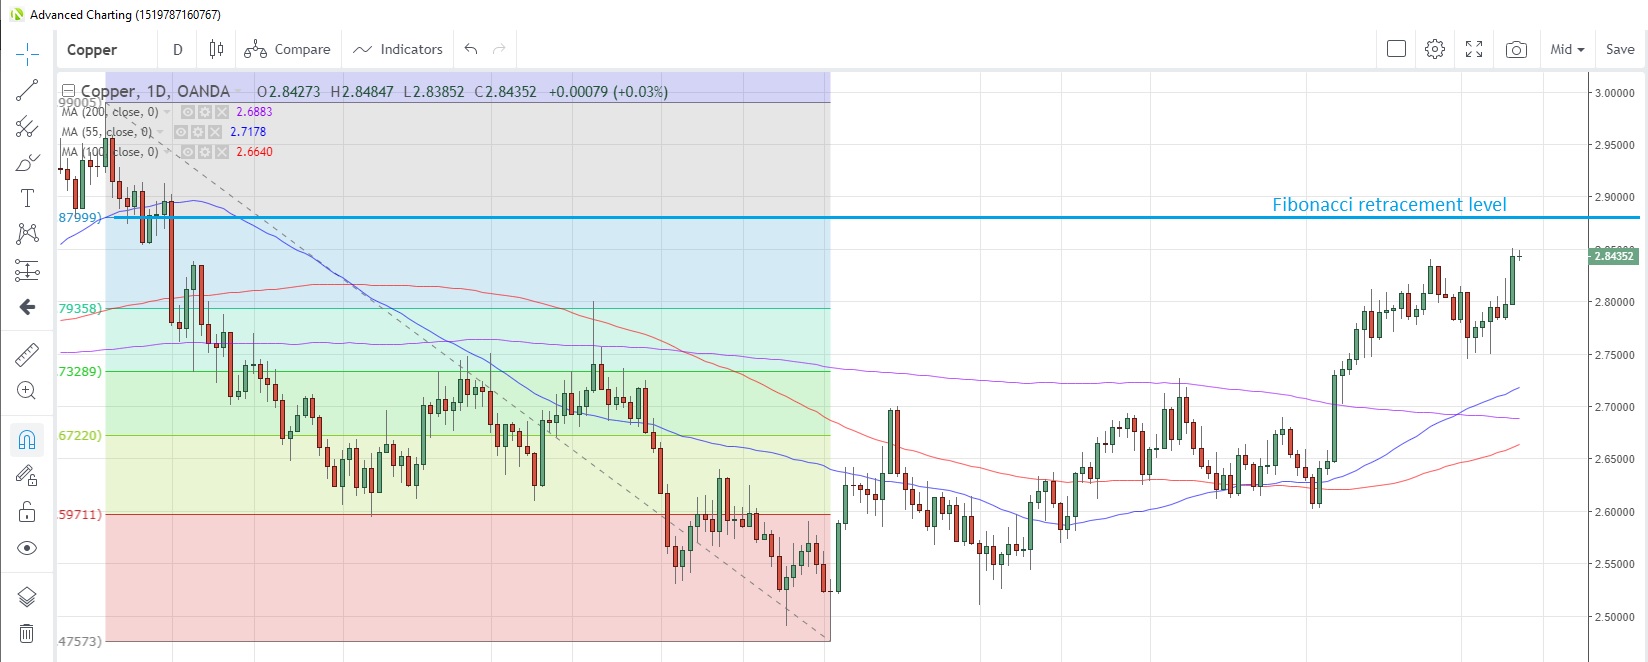
The metal is heading toward the 78.6% Fibonacci retracement of the April-September decline at 2.88, while the 100-month moving average is at 2.917.
Copper Daily Chart

Agriculturals
CORN is hovering near the 200-day moving average at 3.8201 after closing slightly above it yesterday for the first time in almost two weeks. The bid tone is rather surprising given the USDA’s WASDE report (World Agricultural Supply and Demand Estimates) on Friday suggested higher yields for US corn acreage for the current season.
Speculative investors were net buyers of the commodity for a fourth week to January 7, boosting net long positions to levels not seen since August 20.
SOYBEAN prices have traded in a relatively tight range so far this year, trapped in a 9.25-9.45 range. The 9.25 base line appears to be quite strong after it resisted a few tests since December 23. Hopes are for renewed orders from China, the world’s biggest soybean importer, once the trade deal is signed.
Speculative investors turned net sellers for the first time in four weeks, according to the latest report from CFTC as at January 7.
WHEAT prices hit a 17-month high last week following reports that US planting this season was at the lowest in a century. French exports of soft wheat hit a seven-year high last month, despite intermittent strikes at some ports which disrupted loadings. Exports hit 134 million tonnes, the highest December total since 2013, according to Bloomberg calculations. The boost in exports comes as a result of a record harvest combined with less competition from Russia and increased demand from China.
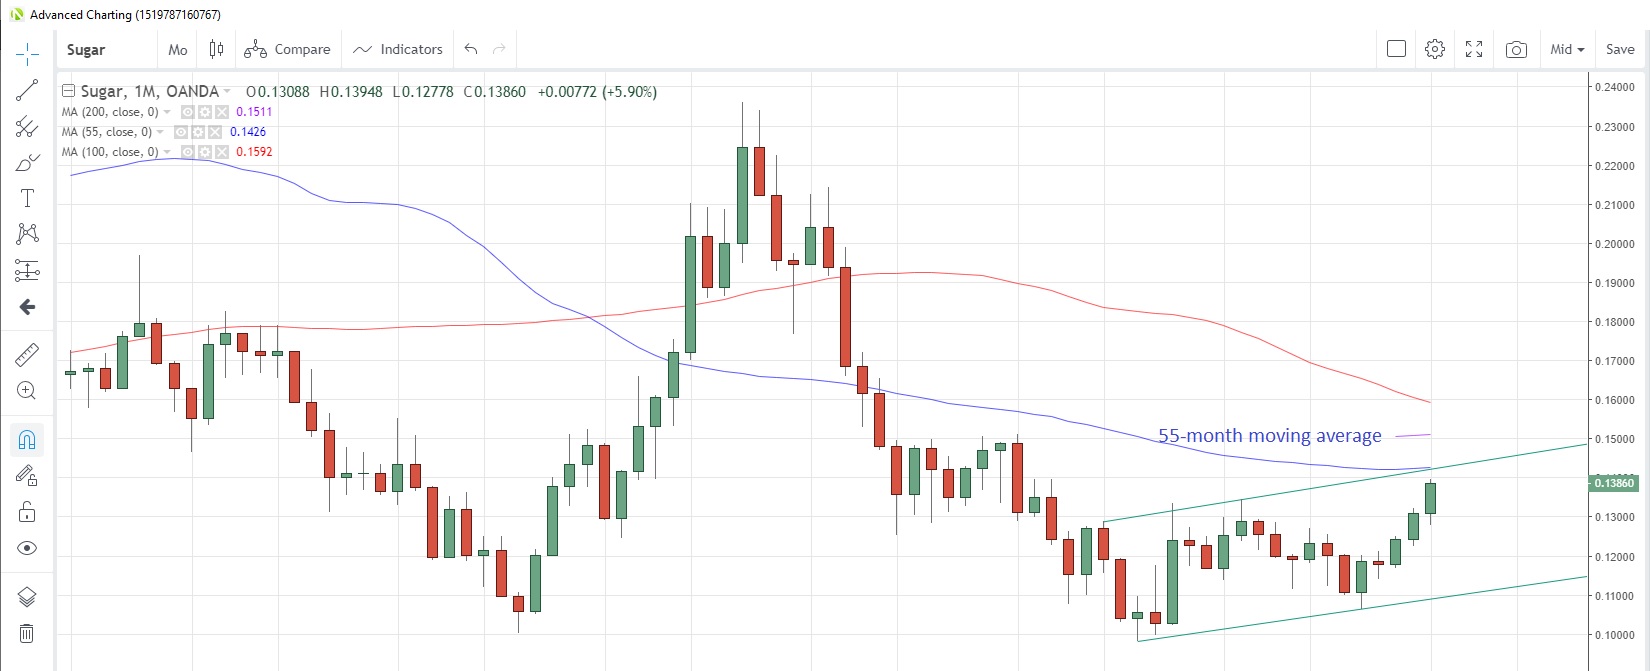
Sugar Monthly Chart

SUGAR prices hit a 22-month high yesterday as investors continue to focus on the expected supply/demand mismatch for this season. In a recent client note, Citigroup (NYSE:C) estimated the shortfall for this year at 7.6 million tons, with crop risks in India and Thailand and lower output from Brazil as a result of higher ethanol demand adding to the bid bias.
Speculative investors scaled back net long positions for a second straight week to January 7, latest CFTC data show.
The 55-month moving average is at 0.1426, and has capped prices since May 2017. There is also the upper band of a rising channel around the 0.1415 level.
