The one topic driving sentiment in markets these days is the spread of the CoVid-19 virus beyond China’s borders. Safe-haven assets are in demand, boosting gold, the US dollar and US Treasuries, but hurting industrial metals and oil. The agricultural sector is trading mostly softer amid fears China’s buying of US produce may slow near-term, and is also a victim of the firmer greenback.
Precious metals
GOLD spiked to a seven-year high yesterday as the number of CoVid-19 cases outside of China spiked, with South Korea seeing a ten-fold increase over five days prompting a code red alert status to be announced in the country. Gold posted the biggest weekly gain since August last week and has touched the highest since February 2013 this week as its safe-haven status escalated.
The jump in gold prices has been kind to Australian miners, whose share prices have risen, but hasn’t been so favourable for the rest of the Australian shares, with the Australia200 index falling the most since August 2019 yesterday.
Speculative investors have also been rushing into safe-haven assets, boosting net long gold positions to the highest on record going back to 1993, according to the latest CFTC data.
SILVER has been rallying for the past three weeks and touched the highest since September 5 yesterday. Silver’s advances have lagged gold’s gains more recently however, so the gold/silver (Mint) ratio has climbed for three straight days. So far, it would appear the rising streak will be broken today.
Speculative investors have also been loading up on silver, lifting net long positions to the highest since April 2017, according to the latest data snapshot from CFTC as at February 18.
The latest rush to safe-haven assets has indicated that investors regard PALLADIUM more as an industrial metal rather than a precious metal/safe-haven asset, probably due to limited supply and a lack of liquidity in the asset. Palladium is trading weaker so far this week and could bring the recent three-week rally to an end, the reverse of what we have seen in gold.
Speculative investors trimmed net long positions to the lowest since August 2018. They have been net sellers of the commodity for the past five weeks, CFTC data to February 18 show, but during that time palladium jumped to a record high.
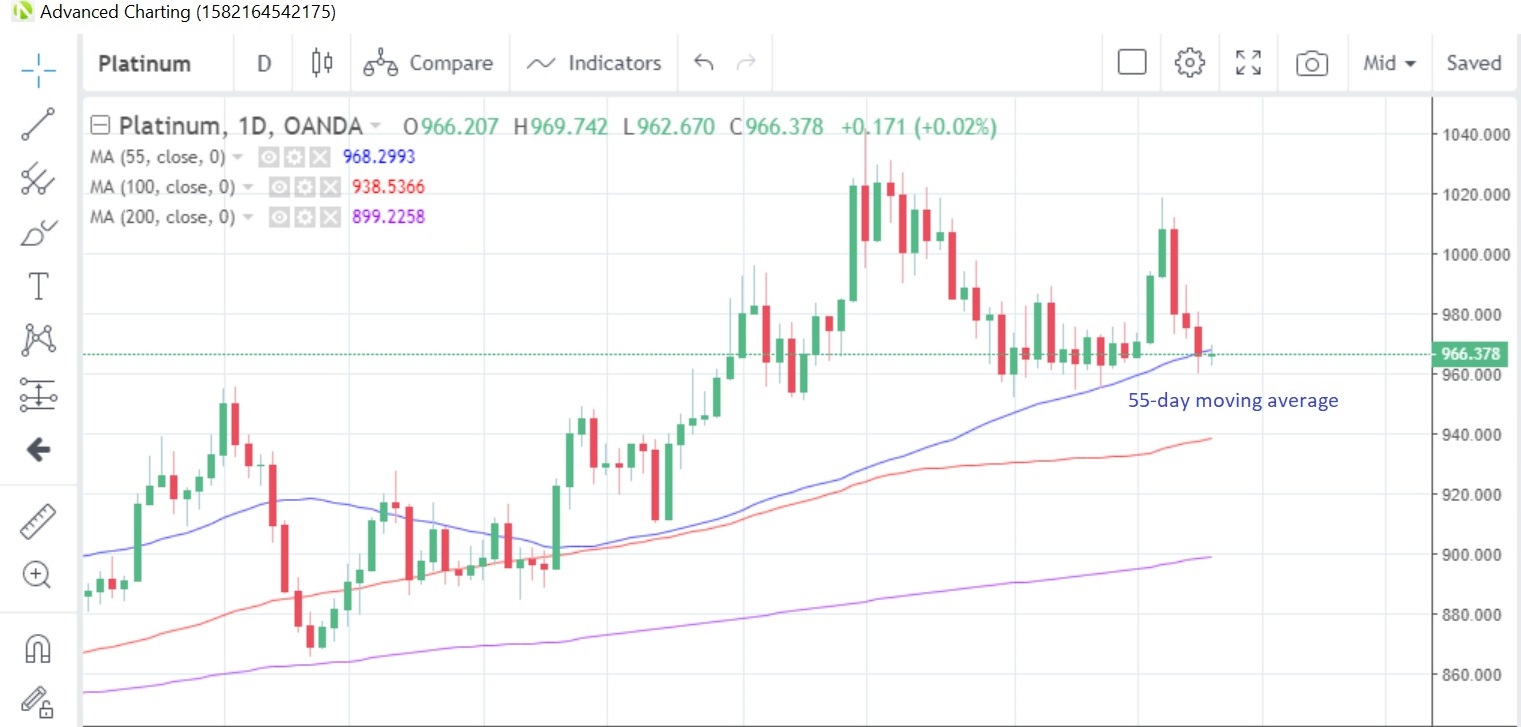
PLATINUM closed below the 55-day moving average at 967.0 yesterday, the first time it has done so since December 9. Speculative investors were net sellers of platinum for a third straight week to February 18, CFTC data show, and net long positions are now at the lowest since the week of December 24.
Platinum Daily Chart

Base metals
COPPER has been on a three-week rising streak, which last happened in December, but it may be coming to a halt this week after the latest acceleration in CoVid-19 cases globally raised concerns about industrial demand for the metal going forward. That said, copper stocks in warehouses monitored by the London Metal Exchange (LME) were at the lowest in five weeks as of last Friday.
Overall, speculative accounts remain net bearish on the commodity, but were net buyers for the first time in four weeks to February 18, according to CFTC data. That reduced net short positions from a four-month peak.
Energy
CRUDE OIL prices fell yesterday with West Texas Intermediate (WTI) crashing to the biggest one-day loss since January 8 and falling to the lowest in 12 days in the process. The global spike in CoVid-19 cases has raised questions about future demand for oil, while the inaction by OPEC and its allies to cut production to stem oil’s slide added extra pressure.
Rumours circulating on newswires yesterday that Saudi Arabia intends to split from OPEC were derided by the country’s energy minister as nonsense. OPEC+ will hold its next meeting in early-March.
Speculative accounts were net buyers of crude oil for the first time in six weeks to February 18, CFTC data show. That raised net long positions from near four-month lows.
NATURAL GAS prices have fallen for the last three days but are showing some signs of a mild rebound so far today. Colder weather forecast for the UK and Scandinavia next week is being mitigated somewhat by reduced prospects of a cold snap in the US.
As a result of the CoVid-19 outbreak, China has said it will bring forward plans to introduce off-peak season natural gas prices to reduce costs for enterprises and help them overcome the impact of the virus’ spread.
Speculative investors trimmed net short positions for a third consecutive week to February 18, and they are now at the lowest in six weeks, according to the latest report from CFTC.
Agriculturals
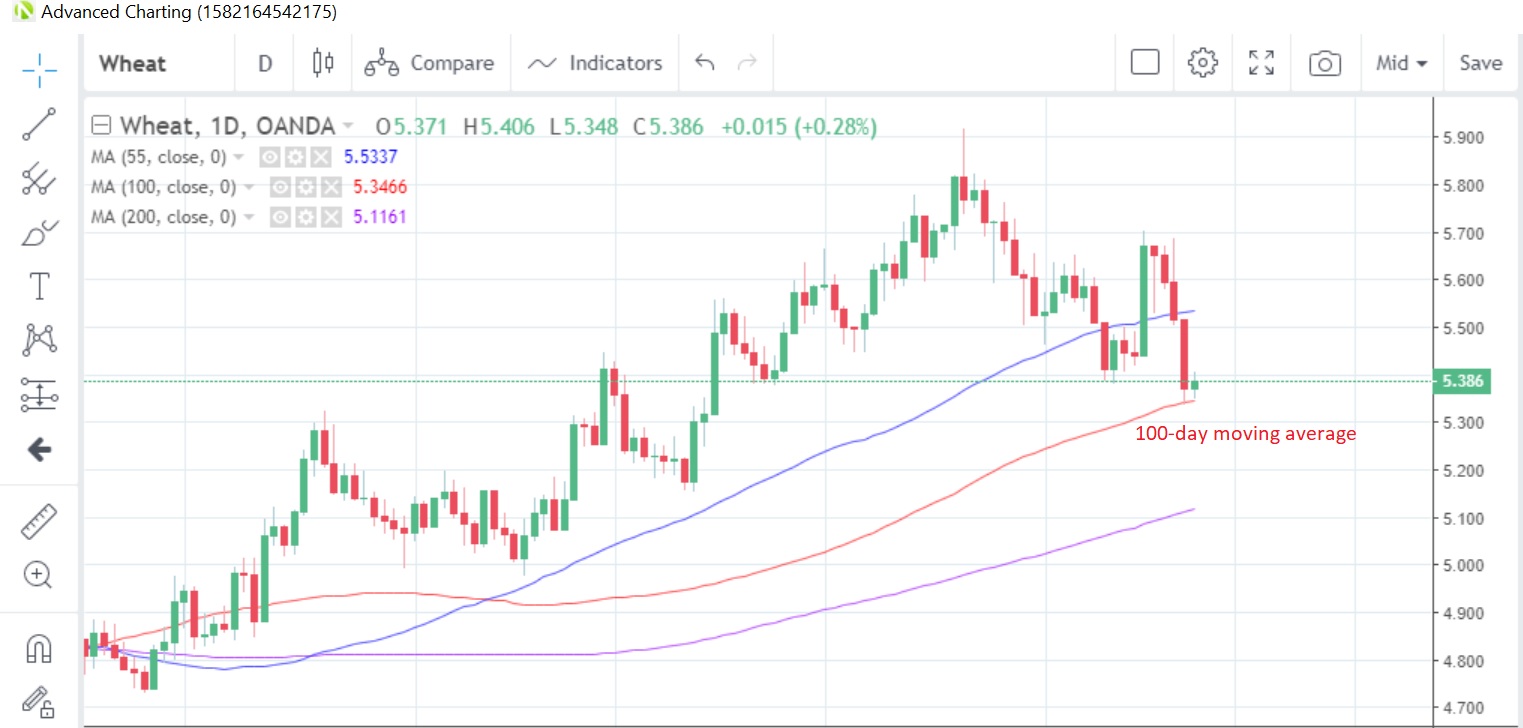
WHEAT prices have fallen for the past four sessions and are testing the 100-day moving average at 5.3466. That moving average has supported prices since October 11. The commodity is falling victim to a firmer US dollar and fears that the virus outbreak could reduce China’s demand for US agricultural produce.
Wheat Daily Chart

SUGAR looks poised to decline for the first time in five weeks, if current levels can be maintained this week. Prices will likely remain supported however, due to an anticipated global supply shortage for this season. Fitch Solutions has estimated that the worst drought to hit Thailand in 40 years could reduce Thai sugar production to 9.8 million tons for the 2019/20 season. That’s a 32.5% drop from 2018/19.
Speculative investors boosted net long positions to the highest since February 2017 in the latest reporting data to February 18.
SOYBEANS have also been under pressure for the past three days, falling the most since January 30 yesterday and almost wiping out the whole of the month’s gains in the process. An expected drop in demand after the virus escalation are behind the decline, along with pressure from a firmer greenback.
The decline comes even as the US Department of Agriculture (USDA) forecast that domestic soybean stocks would end the 2020/21 season at a four-year low. Speculative investors turned net buyers of the commodity for the first time in five weeks, increasing net short positions from two-month lows.
In contrast, the USDA has predicted that the US CORN crop would be 15.5 million bushels, boosting forecast end of season stockpiles to the highest since 1998. Corn prices fell to the lowest since December 13 yesterday, extend the recent downtrend to a fourth day.
