The demand for safe-haven assets declines as equity markets ignore the escalating coronavirus cases and deaths and instead focus on driving most US indices to record highs. The strong jobs report last Friday added to the positive risk mood and helped lift oil prices from near 13-month lows, while the agricultural commodities have mixed results.
Precious metals
GOLD prices look poised to bring the recent four-day winning streak to an end today as risk appetite returns ahead of Powell’s semi-annual testimony today. The US economy appears to be firing on all cylinders after the latest payroll report, but Powell will likely make reference to the headwinds from the coronavirus outbreak. While the World Health Organization chief has warned to expect more cases of the virus beyond China, the fact that China has allocated a hefty $10 billion to fight the virus appears to have placated most market bears, for now.
Exchange-traded funds added to gold holdings for a 13th straight day yesterday, according to a Bloomberg report, which brought total gold holdings to 83.1 million ounces, the highest in a year. Speculative investors reduced net long positions to the least since the week of December 17, a seven-week low.
XAU/USD has been making a series of lower highs since the near-term peak at 1,612 on January 8, and gold’s inability to climb above the February 3 high more recently has introduced an element of bearishness from a technical perspective. The 55-day moving average has moved up to 1,522.40.
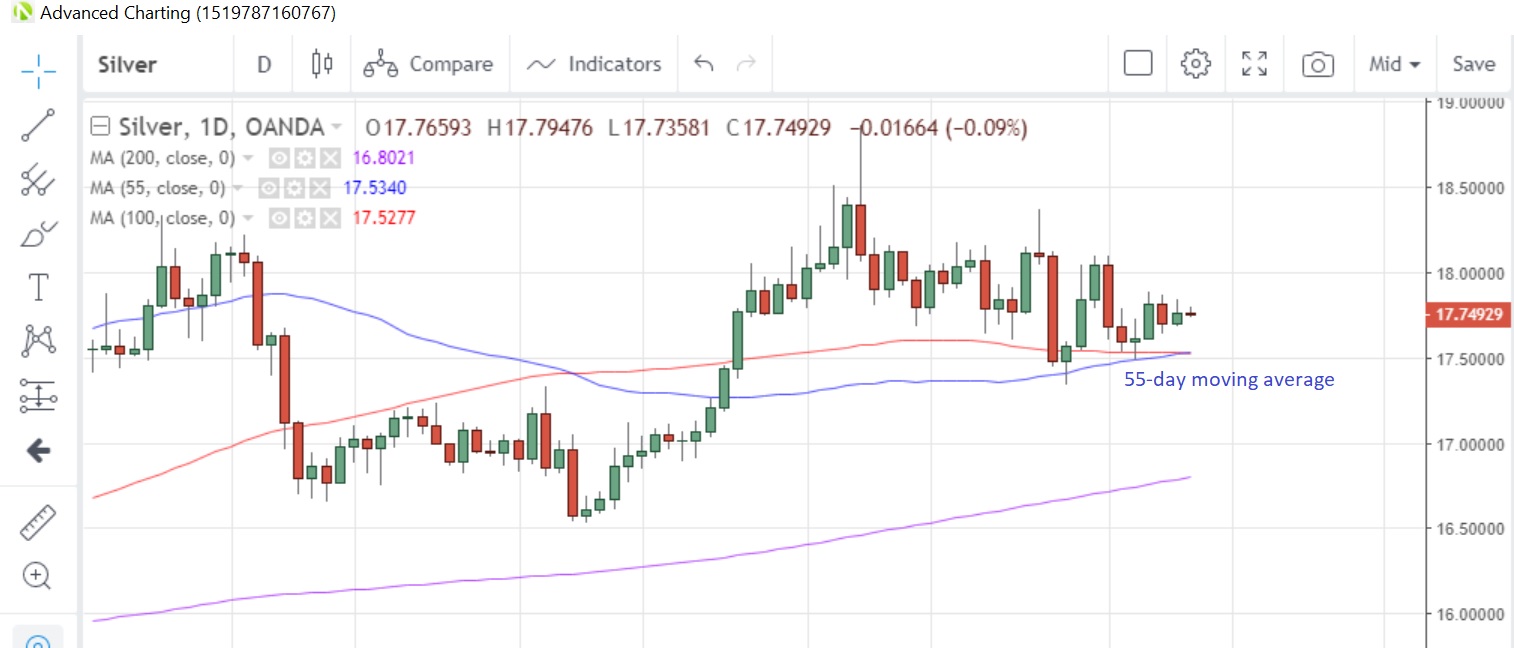
SILVER is managing to maintain its footing above the 55-day moving average, which is at 17.5339 today. That moving average has supported prices on a closing basis since December 23. Like gold, silver has been printing a series of lower cycle highs since January 8 and a close below this moving average could turn markets bearish.
Speculative accounts were net buyers of silver in the week to February 4, according to the latest report from CFTC.
Silver Daily Chart

PLATINUM is edging lower toward the 55-day moving average, which is at 954.19 today and has supported prices since December 10. A feared global slowdown from the coronavirus is tempering expectations for future demand for the metal. Speculative investors appear to be unenthusiastic about the metal’s fortunes as well, as they turned net sellers for the first time in 12 weeks in the week to February 4, pulling net long positioning from record highs, according to the latest data snapshot from CFTC.
PALLADIUM continues to consolidate last month’s move to record highs and subsequent drop. The metal has been confined to a relatively tight 2,259 – 2,502 range so far this month, with the 55-day moving average rising to 2,090. Speculative investors were net sellers for a fourth straight week to February 4, and net long positions are currently the lowest since September 2018.
Base metals
COPPER prices appear to be building on last week’s advance, the first in three weeks, despite the uncertain outlook for copper demand. The metal has been posting higher cycle lows since the start of the month and, if this momentum can continue, could be aiming for the 200-day moving average, which is at 2.6640 today.
Energy
The lack of concrete announcements from OPEC and its allies has meant that CRUDE OIL prices continue to be under pressure, with West Texas Intermediate (WTI) hovering just above the $50 mark. The only OPEC-related news has been from Algeria, whose oil minister said that the OPEC panel recommended the extension of current production cuts through to the end of this year. That, so far, has failed to help oil prices. Oil industry consultant FGE has estimated that China demand is down by about 3.2 million barrels per day (bpd) as a result of the coronavirus spread.
Speculative investors have been net sellers of crude oil futures for the past four weeks, according to CFTC data as at February 4. While net positioning is still long, positions have been scaled back to the lowest since the week of October 29.
NATURAL GAS prices remain under pressure with above-average temperatures expected across the eastern half of the US in the February 15-19 period. Prices hit the lowest on record going back to 2003 yesterday, and are little changed this morning.
With prices at extreme lows, some speculative investors appear to be attempting to pick a near-term bottom as they turned net buyers of the commodity in the week to February 4, the first time in six weeks, lifting net short positions from record levels.
Agriculturals
In contrast to other agricultural commodities, SUGAR has trended higher for the past three weeks and hit the highest level since January 2018 yesterday. Investors continue to focus on an expected output shortfall for this year, but took the higher levels as an opportunity to book some profits. They were net sellers of the commodity in the week to February 4, the first time in four weeks, and trimmed net long positions from record highs.
Sugar closed above the 200-week moving average at 0.1447 for the first time since May 2017 last week and looks to be extending those gains into this week.
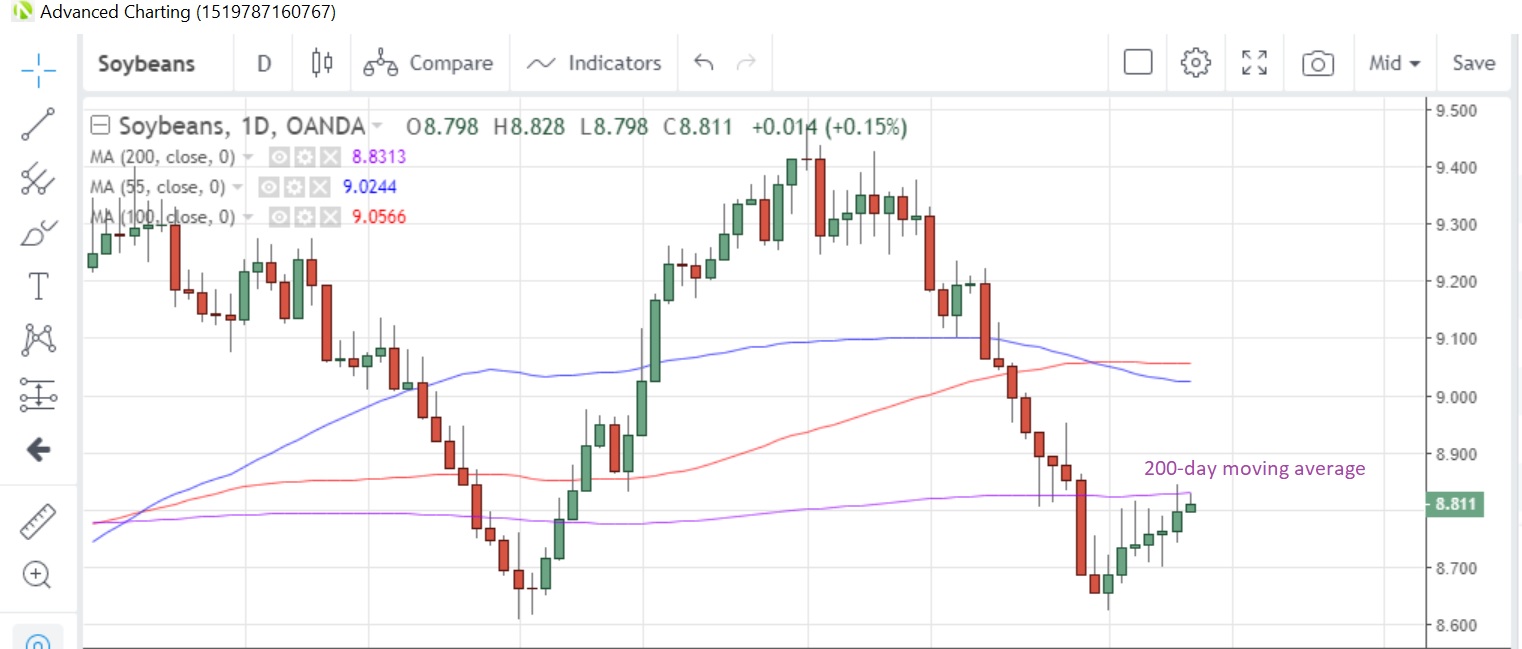
SOYBEAN prices look set to advance for a seventh straight day today and look to retest the 200-day moving average at 8.8314. That moving average has capped gains on a closing basis since January 30. The market was also boosted by a Bloomberg report that China had bought Brazil soybeans last week. Speculative investors were net sellers for a third week to February 4, boosting net short positions to the highest since the week of December 10.
Soybeans Daily Chart

WHEAT prices could be facing the first daily close below the 55-day moving average since September 25 as prices hit the lowest in more than a week this morning. Speculative investors remain bullish on the commodity, with net long positions the highest since September 2018, according to the latest report as at February 4 from CFTC.
CORN prices are still trapped within a tight 3.88-3.60 range since September and are currently holding above the 55-day moving average at 3.7522.
