Hopes that the US and China will “soon” sign the Phase 1 trade deal has kept risk appetite buoyant to the detriment of safe haven assets. Energy markets are consolidating lower, while the agricultural sector has gotten over the early euphoria of the pending trade deal.
Precious metals
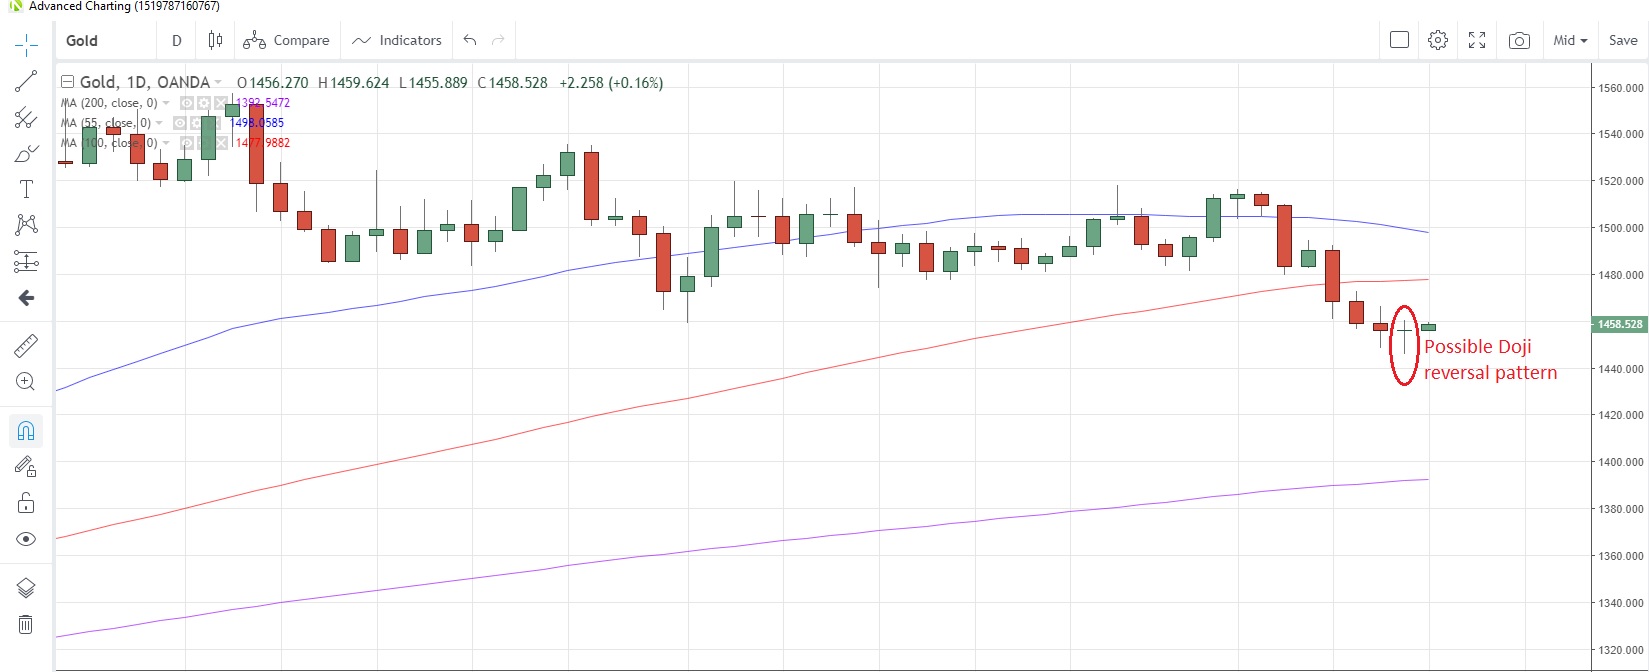
GOLD prices posted the biggest weekly drop in three years last week as sentiment and official comments about the prospects of a US-China trade deal increased. Gold was pushed down to a three-month low of 1,445.60, though a potential Doji candlestick formation could signal that it might be a near-term low. A higher close today would confirm this setup.
Gold Daily Chart

Speculative investors are regarding the latest move lower as corrective because they continued to buy gold for a third consecutive week to November 5, according to the latest data from CFTC, pushing net long positions to the highest in six weeks. In contrast, the world’s biggest gold exchange traded fund (ETF) saw the most outflows in three years, Bloomberg reported last Friday.
SILVER likewise is hovering near three-month lows after posting the biggest weekly loss since October 2016 last week. The metal is falling toward the 200-day moving average at 16.1307, which has supported prices since July 9. Speculative accounts turned net sellers in the week to November 5, the first time in three weeks, just ahead of the big drop. Investors are still positioned net long however. The gold/silver (Mint) ratio surged last week and is now sitting just above the 200-day moving average at 86.44.
PLATINUM prices have plunged for the past four days, dropping as much as 7.3% over the period to touch 865.75, the lowest since August 27 yesterday. The 200-day moving average is at 863.40 and remains untested since July 15. Speculative investors were caught unawares by the latest drop as bullish bets on the commodity were at the highest in more than three years as at November 5, according to the latest data snapshot from CFTC.
PALLADIUM prices tumbled Monday on reports that a wage deal with South Africa’s largest mining union had been struck, thus alleviating fears that the supply chain might be disrupted. The metal fell to the lowest in more than a month but found some support ahead of the 55-day moving average at 1,678.6. That moving average has supported prices since end-August.
Speculative investors had turned net sellers ahead of the decline and had trimmed net long positions to the lowest in seven weeks, CFTC data show.
Base metals
COPPER prices had been encouraged by the prospect of a US-China trade deal and had reached a 3-1/2 month high last Thursday. However, a lack of details and a genuine timeline have taken their toll and the industrial metal has fallen for the past four sessions, dropping 2.5% in the process. Warehouse stocks of copper monitored by the London Metal Exchange were at the highest since October 22 as at last Monday.
Speculative investors are overall still bearish on the base metal, but have reduced net short positions to the lowest since the week of May 21, according to the latest CFTC data as at November 5.
Energy
CRUDE OIL prices have eased off from seven-week highs as concerns mount that there may not be unity among OPEC members and their allies in seeking deeper production cuts at next month’s meeting. Russia appears to be dragging its heels in agreeing to the cuts, while a number of OPEC members have not stuck to previously agreed levels. Saudi Arabia’s output jumped to 10.3 million barrels per day (bpd) in October as it worked to replenish reserves lost during the period after the September attacks.
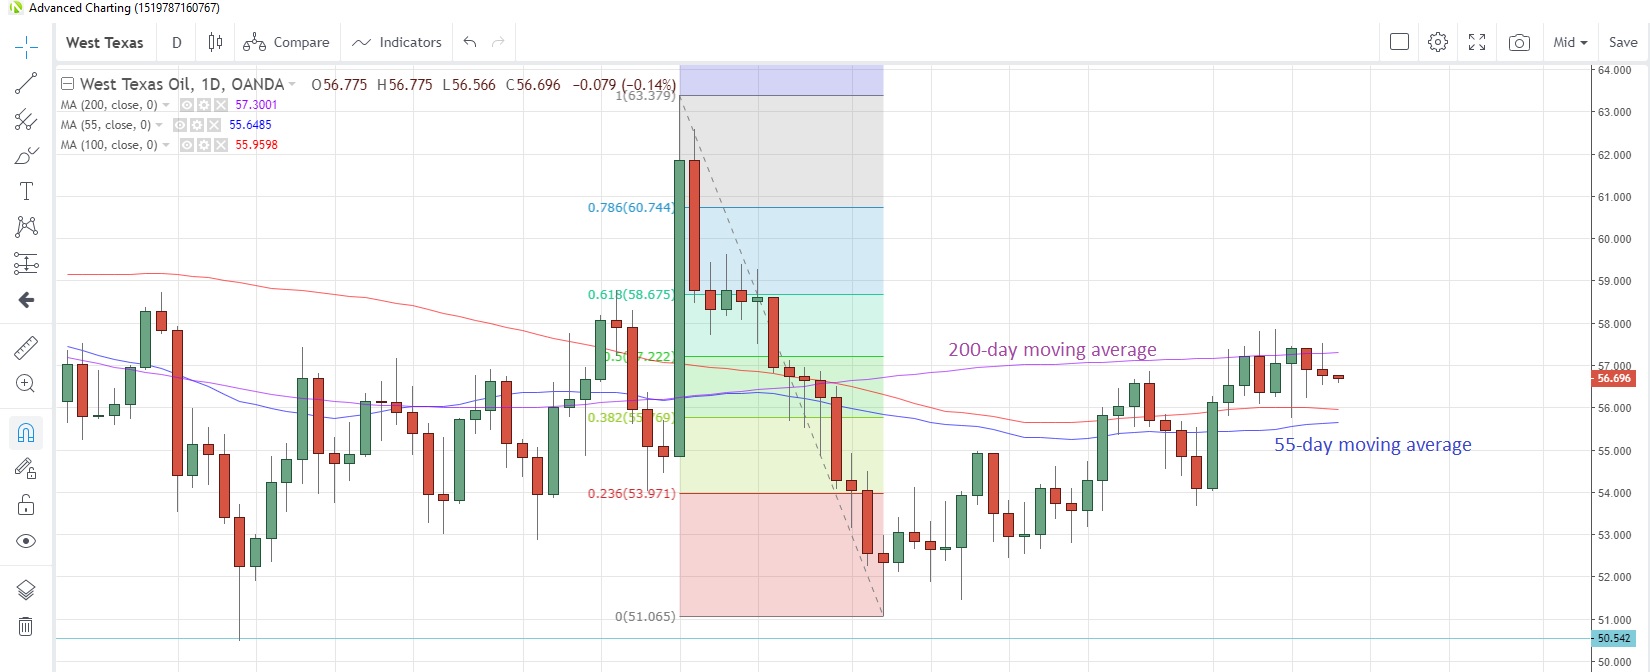
If there is no agreement on deeper cuts, US investment bank Morgan Stanley (NYSE:MS) sees oil prices dropping to $45 per barrel, according to Bloomberg reports. West Texas Intermediate (WTI) is now at $56.68 with the 55-day moving average below at $55.65.
WTI Daily Chart

NATURAL GAS has traded with a softer bias this week after losing more than 5% on Monday, the biggest daily drop since January. Weather forecasts are putting pressure on prices, with the current US cold snap expected to dissolve by the end of the month. Last week’s inventory data from the EIA came in at a lower rate and below expectations. They rose a smaller 34 billion cubic feet (bcf) to 3.7 trillion cubic feet as at November 1.
Speculative accounts reduced net short positions for a second straight week to November 5, according to CFTC data. Net short positions are now at the lowest in five weeks.
India’s oil minister said yesterday that the Indian economy was moving toward a gas-based economy, away from a crude-based one.
Agriculturals
SUGAR prices are testing the 200-day moving average resistance at 0.1201 after recovering from the month’s lows this week. News that China’s biggest sugar producing area, Guangxi, has announced it is to sell more than 127,000 tons from reserves in the second half of this month is helping to keep a lid on prices. Meanwhile, ethanol demand in Brazil reportedly hit a record high in October.
SOYBEANS prices are down the most in eight weeks so far this week, testing the 100-week moving average at 9.068 for the second time in five weeks. Speculative investors turned net sellers for the first time in eight weeks in the week to November 5, according to CFTC data. That helped pull net long positions from the highest since June 2018.
CORN prices touched the lowest since end-September last week and have spent this week consolidating that move above the 100-week moving average at 3.7030. Evidence that the US Midwest is experiencing cold weather which could delay corn harvests is helping support the agricultural commodity. The market is still bearish however, with net short positions at the highest since the week of September 24.
WHEAT’s rally to mid-October appears to have run out of steam, with no new concrete news of a US-China trade deal being signed to drive prices higher. The market has already reacted to the prospect of China buying larger amounts of US agricultural produce, so the consolidation theme may continue for a while. Speculative investors appear to be losing patience and trimmed net long positions for a second week, according to CFTC data to November 5.
