The virility and spread of the CoVid-19 virus are overcoming both data and testimony from Fed Chairman Powell suggesting the US economy is performing well, pulling US equities from record highs and boosting gold’s safe-haven status. Oil prices are higher, focusing on the US economic prospects, while the agricultural commodities are mixed.
Precious metals
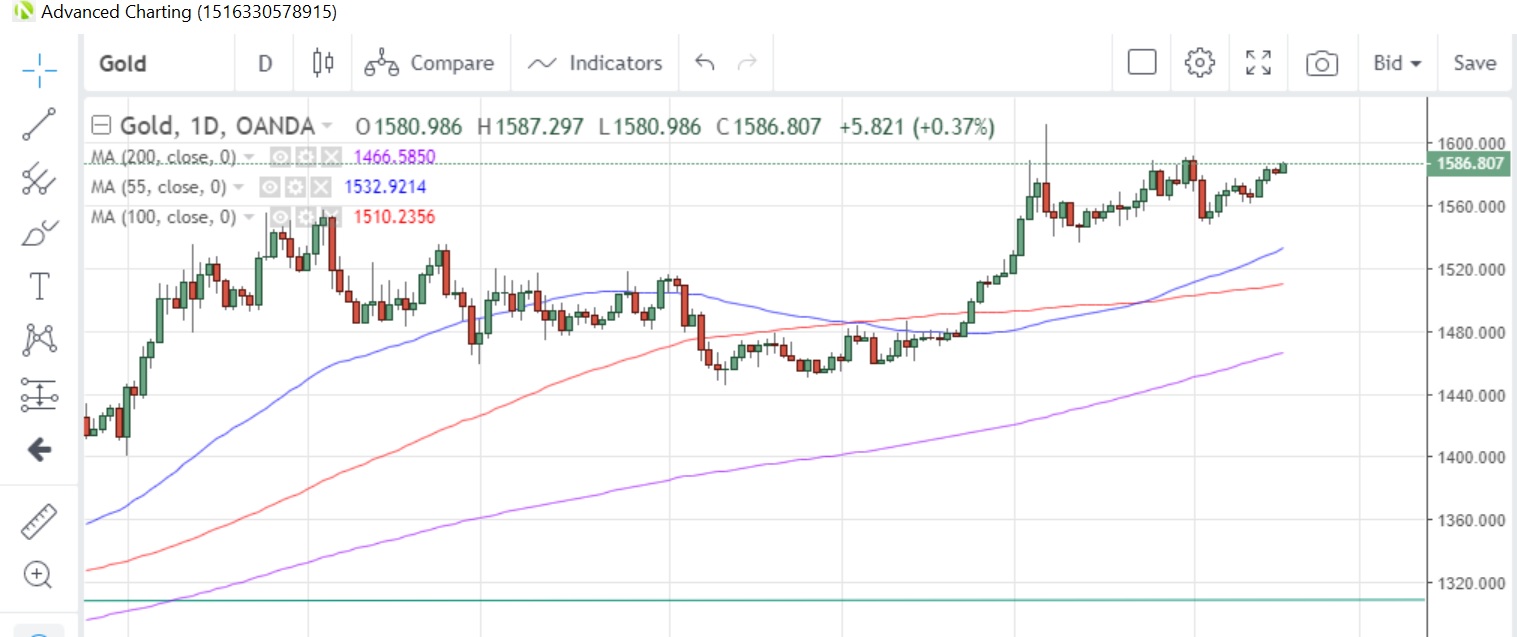
GOLD prices are at the highest since February 3 despite recent news that a number of countries are planning extra fiscal stimulus measures to shore up their economies from the virus effect. The number of global CoVid-19 virus cases continues to rise, albeit at a slackening pace, and investors are trying to assess whether the fiscal response will be enough to keep the global growth engine alive.
Funds placed in bullion-backed exchange-traded funds (ETFs) are at record levels after five weeks of inflows, according to a Bloomberg report, while speculative investors were net buyers of the precious metal in the week to February 11, according to the latest CFTC data.
Gold prices are attempting to take out the February 3 high of 1,592 while the 55-day moving average has moved up to 1,532.90.
Gold Daily Chart

SILVER is on track for its fourth daily gain in a row, pulling the commodity off the 100-day moving average, which is at 17.49 today. The gold/silver (Mint) ratio, in contrast, has fallen for four days, the longest losing streak since December. Silver speculative investors were modest sellers in the week to February 11, CFTC data show.
PLATINUM continues to hold above the 55-day moving average at 959.38, which has supported prices on a closing basis since December 10. The metal has traded in a tight 950-975 range for almost two weeks and investors are waiting for a breakout. Speculative accounts appear to have run out of patience as they were net sellers for a second straight week, trimming net longs to the lowest in seven weeks, according to the latest data snapshot as at February 11.
PALLADIUM has touched a new record high this morning, despite the threat of the CoVid-19 virus. Speculative investors had been more cautious about palladium’s prospects, reducing net long positions to the least since August 2018, the most recent data from CFTC show.
Base metals
COPPER prices hit the highest levels since January 27 yesterday as China’s manufacturing sector gradually returns to work. The virus has forced the shutdown of China’s largest steel-producing province, with some commodity-related companies remaining closed until March.
Speculative investors were net sellers of the commodity for the third straight week in the week to February 11, according to the latest CFTC data snapshot, boosting net short positions to the highest since the week of October 15. Copper stocks at warehouses monitored by the London Metal Exchange (LME) have been steady for the past 1-1/2 weeks.
Energy
CRUDE OIL prices rose for the first time in six weeks last week as data showed the US economy was performing very well. The advance was the biggest weekly gain since early-December, and pulled West Texas Intermediate (WTI) to the highest level this month. However, gains were capped by a lack of announcements from OPEC and its allies regarding further production cuts. Saudi Arabia’s hopes for an early get-together before the scheduled March meeting appear to have been dashed. In addition, the cautious optimism that the virus could be contained within China appear to be on shaky ground, with more deaths outside the Chinese borders reported in the past week.
Speculative investors were net sellers for a fifth consecutive week to February 11, according to CFTC data, with net long positions now the lowest since the week of October 29.
WTI was heading toward the 23.6% Fibonacci retracement of the January-February drop at $53.136, but is facing the heaviest losses in a week today.
NATURAL GAS climbed the most in one day since July 5 yesterday with colder-than-normal temperatures across the US predicted for the February 24 to March 1 period. Investors ignored data which showed China’s natural gas demand posted the first year-on-year contraction in two years as the virus tightened its grip on the economy. Bloomberg reported that a 14% drop in industrial demand and 10% from power utilities contributed to the drop.
Speculative investors reduced net short positions for a second consecutive week in the week to February 11, according to CFTC data.
Agriculturals
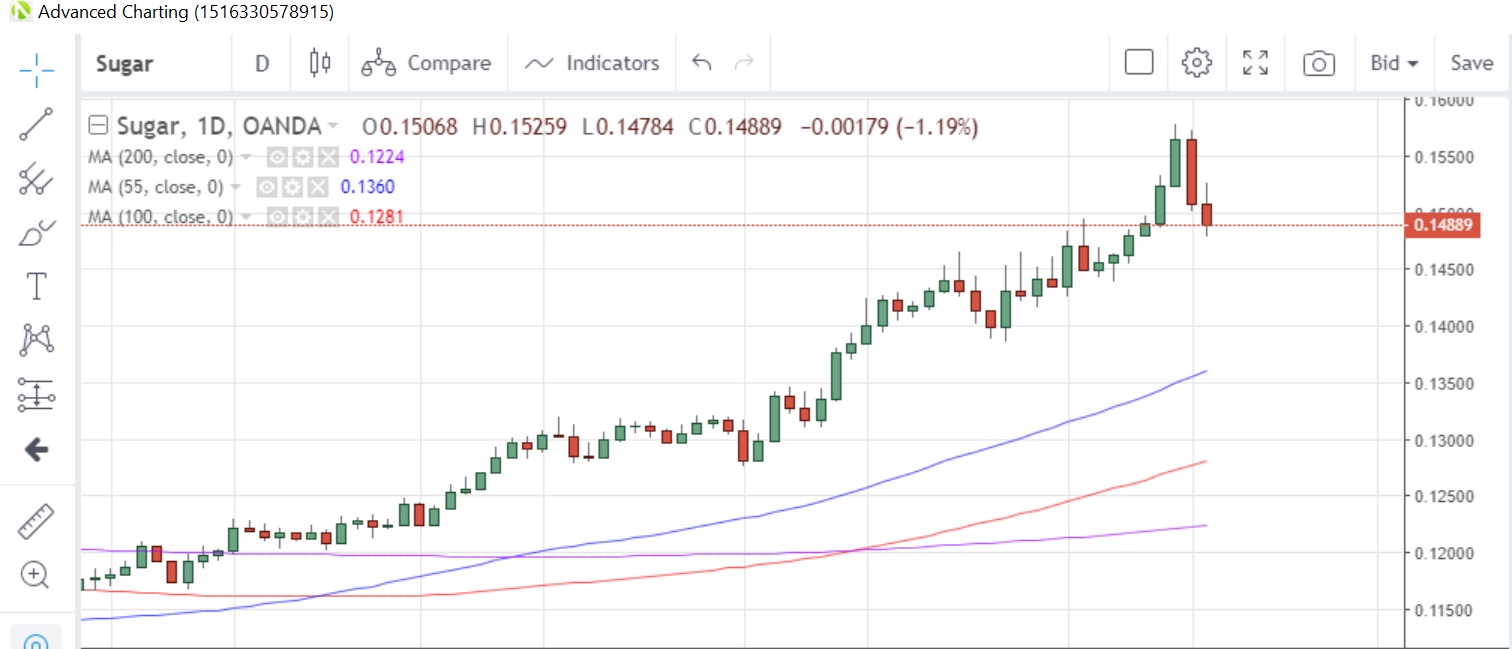
SUGAR remains well supported on the projected shortage for this year, despite falling on the last two days of last week. Markets were closed yesterday due to the US President’s Day holiday and could face the first weekly loss in four weeks this week.
A drought in Thailand is putting pressure on already stretched supply lines, while on the demand side Indonesia has announced it plans to import 1.4 million tons of sugar for household use this year. That’s an 11-fold jump from last year.
Speculative accounts remain bullish on the commodity, lifting net long positions to the most since February 2017 in the last reporting week.
Sugar Daily Chart

SOYBEAN prices climbed for the second straight week last week and are flat so far this week. Bloomberg reported that the US has been able to sell at least four cargoes of soybeans to China in the last two weeks following delays to Brazil shipments due to a late harvest and rain delays in cargo loadings at ports.
Speculative investors were net sellers of soybeans for a fourth week in the week to February 11, boosting net short positions to the highest since the week of December 10.
Soybean prices are facing some near-term resistance at the 100-week moving average at 8.9300, while longer-term resistance is at the 200-week moving average at 9.4470. That moving average has capped prices on a closing basis since June 2018.
CORN has been consolidating in a 3.71-3.82 range since January 27 and is currently gyrating around the 100- and 55-day moving averages at 3.7608 and 3.7548, respectively. Speculative investors were net sellers for a second straight week to February 11, with net long positions now at the lowest in four weeks.
WHEAT prices are consolidating above the eight-week lows struck last week and are currently at 5.503, just near the 55-day moving average at 5.507. Speculative investors scaled back net long positions from 17-month highs in the week to February 11, CFTC data show.
