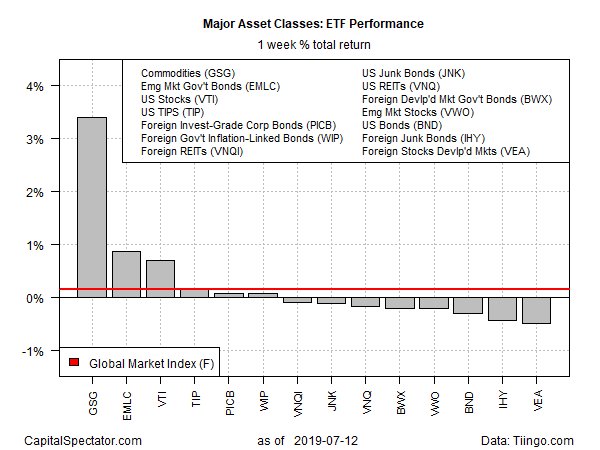
Broadly defined commodities topped last week’s performance ledger for the major asset classes – by a wide margin, based on a set of exchange-traded funds. Most of the gain was linked to higher oil prices, which rose due to a perfect storm of several bullish factors last week.
The iShares S&P GSCI Commodity-Indexed Trust (NYSE:GSG) jumped 3.4% for the trading week through Friday, July 12. The rally lifted the fund to its highest close since late-May.
Several factors were behind the jump in commodity prices. A tropical storm that turned into a hurricane in the Gulf of Mexico triggered fears of a disruption in energy supplies in the region, which is critical for oil and gas production in the US. In addition, heightened geopolitical tensions between the US and Iran played a role in supporting energy prices. It didn’t hurt that last week’s June data on consumer inflation in the US posted slightly higher-than-expected results.
Last week’s weakest performer for the major asset classes: foreign stocks in developed markets. Vanguard FTSE Developed Markets (NYSE:VEA) fell 0.5%, marking the ETF’s first weekly decline in a month.
Meanwhile, an ETF-based version of Global Market Index (GMI.F) continued to edge higher. This unmanaged benchmark, which holds all the major asset classes (except cash) in market-value weights, rose 0.8% — the sixth consecutive weekly gain for GMI.F.

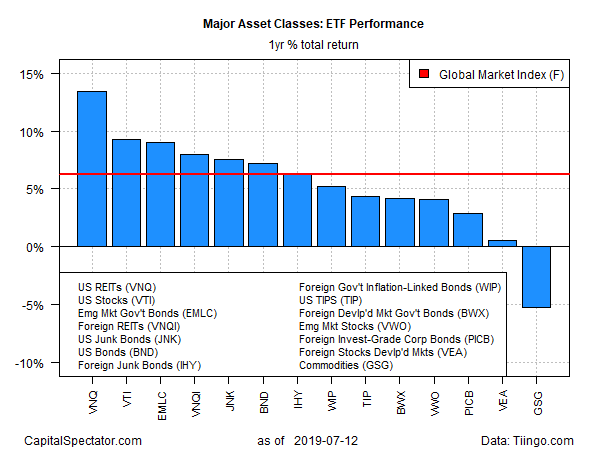
For the one-year trend (252 trading days), US real estate investment trusts continue to lead the major asset classes. Vanguard Real Estate (NYSE:VNQ) is up a solid 13.5% on a total return basis through last week’s close. The gain is moderately above the second-best one-year performer: US stocks via Vanguard Total Stock Market (VTI), which is up 9.2% for the trailing 12-month period.
Despite last week’s rally in commodities, the asset class remains the worst performer on a one-year basis. GSG lost 5.2% over the past year – the only negative print for the major asset classes for the trailing 12-month period as of last week’s close.
For a broadly diversified multi-asset class portfolio, by contrast, the one-year trend remains solidly positive. GMI.F is ahead by 6.3% on a total return basis for the trailing one-year window.

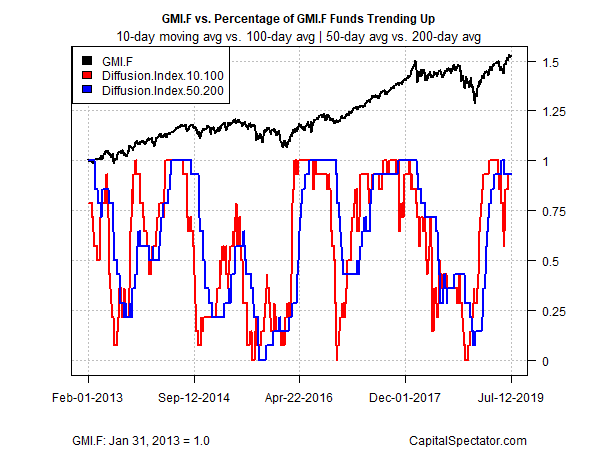
Bullish momentum continues to describe most of the major asset classes, based on the ETFs listed above. The upbeat profile is based on two sets of moving averages. The first compares the 10-day moving average with its 100-day counterpart — a proxy for short-term trending behavior (red line in chart below). A second set of moving averages (50 and 200 days) represents an intermediate measure of the trend (blue line). Using this data through last week’s close reveals that a bullish trend remains in force for nearly all of the funds.

