This article was written exclusively for Investing.com
- Precious metals: a stellar year
- Energy makes a comeback
- Agricultural commodities take off
- Industrial metals surge
- Three reasons the trends will continue
The old saying, “March comes in like a lion and goes out like a lamb,” refers to seasonal factors in the northern hemisphere. March starts with cold winter weather and tends to end with the warming winds of spring. The oldest written reference to the “lion/lamb” proverb comes from the English author, Thomas Fuller, who included it in his 1732 work, “wise sentences, and witty sayings, ancient and modern.”
For the commodities market in 2020, March and April came in like a bearish lion and went out like a bullish lamb. As this year winds down, many commodities are moving toward 2021 in bullish mode.
But readers would be wise to remember that bull markets rarely move in a straight line. Corrections are the norm rather than the exception.
The 2008 global financial crisis was a far different event than the 2020 pandemic. However, the common theme has been how central banks and governments have addressed the economic fallout. The only difference has been that the amount of liquidity and stimulus in 2020 was much higher than in 2008.
From 2008 through 2012, commodity prices rose to multi-year or new all-time highs. The rise came on the back of increased money supply and weaker fiat currencies because of boosted liquidity and stimulus. If 2008 is a model for 2020, we should expect raw materials prices to follow a similar path over the coming years. We have already seen the bullish lamb emerge across many commodity sectors. In the coming years, it could grow into a charging bull.
Precious metals: a stellar year
The four precious metals that trade on the COMEX and NYMEX futures exchanges have moved significantly higher since the end of 2019. Nearby gold futures settled at $1520 on Dec. 30, 2019, and was at the $1880 level on Dec. 24, a rise of 23.7%.
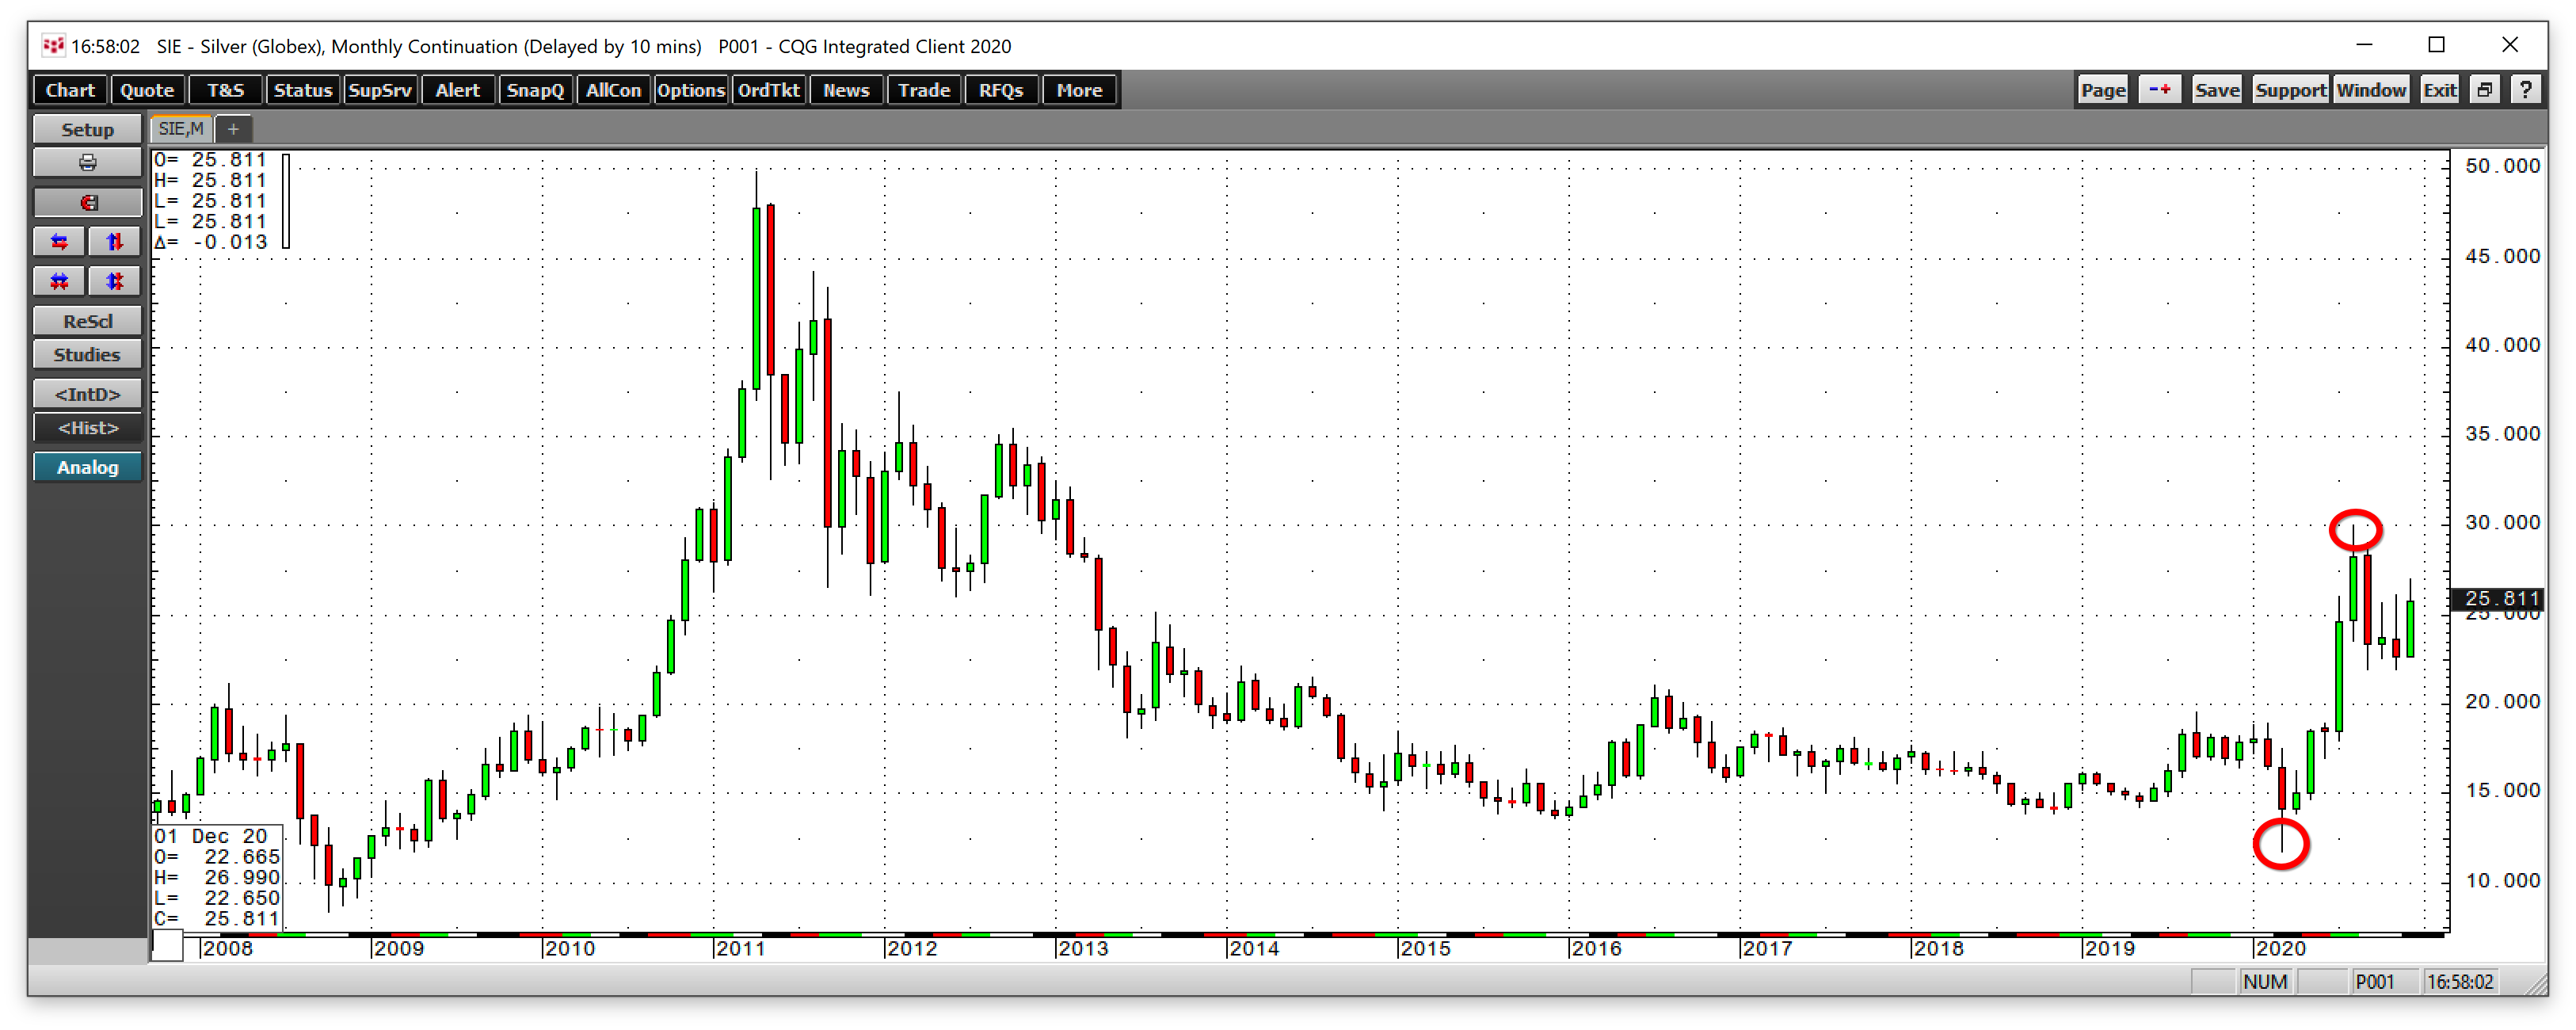
Silver moved from $17.90 to $25.90 or +44.7% so far in 2020. Palladium went from $1912.10 to $2330 or 21.9% higher, while platinum futures appreciated from $965.10 to $1030, or +6.7%. The silver futures market led the way on the upside, but it was a bumpy ride.
Source, all charts: CQG
As the monthly chart shows, silver fell to its lowest price since 2009 when it traded to $11.74 in March. The volatile precious metal then turned around and exploded to its highest level since 2013 when it traded to a high of $29.915 in early August.
Silver was trading a lot closer to the high than the low for the year on Dec. 24, and the bullish trend looks likely to continue into 2021.
Precious metals are all moving into the new year with bullish winds behind their sails.
Energy makes a comeback
2020 was an extremely volatile year for the two leading energy commodities; crude oil and natural gas. The global pandemic caused the demand for petroleum to evaporate, sending the landlocked NYMEX WTI crude oil futures below zero for the first time in April. Crude oil closed 2019 at $61.21 per barrel. Four months later, the price was over $100 lower.
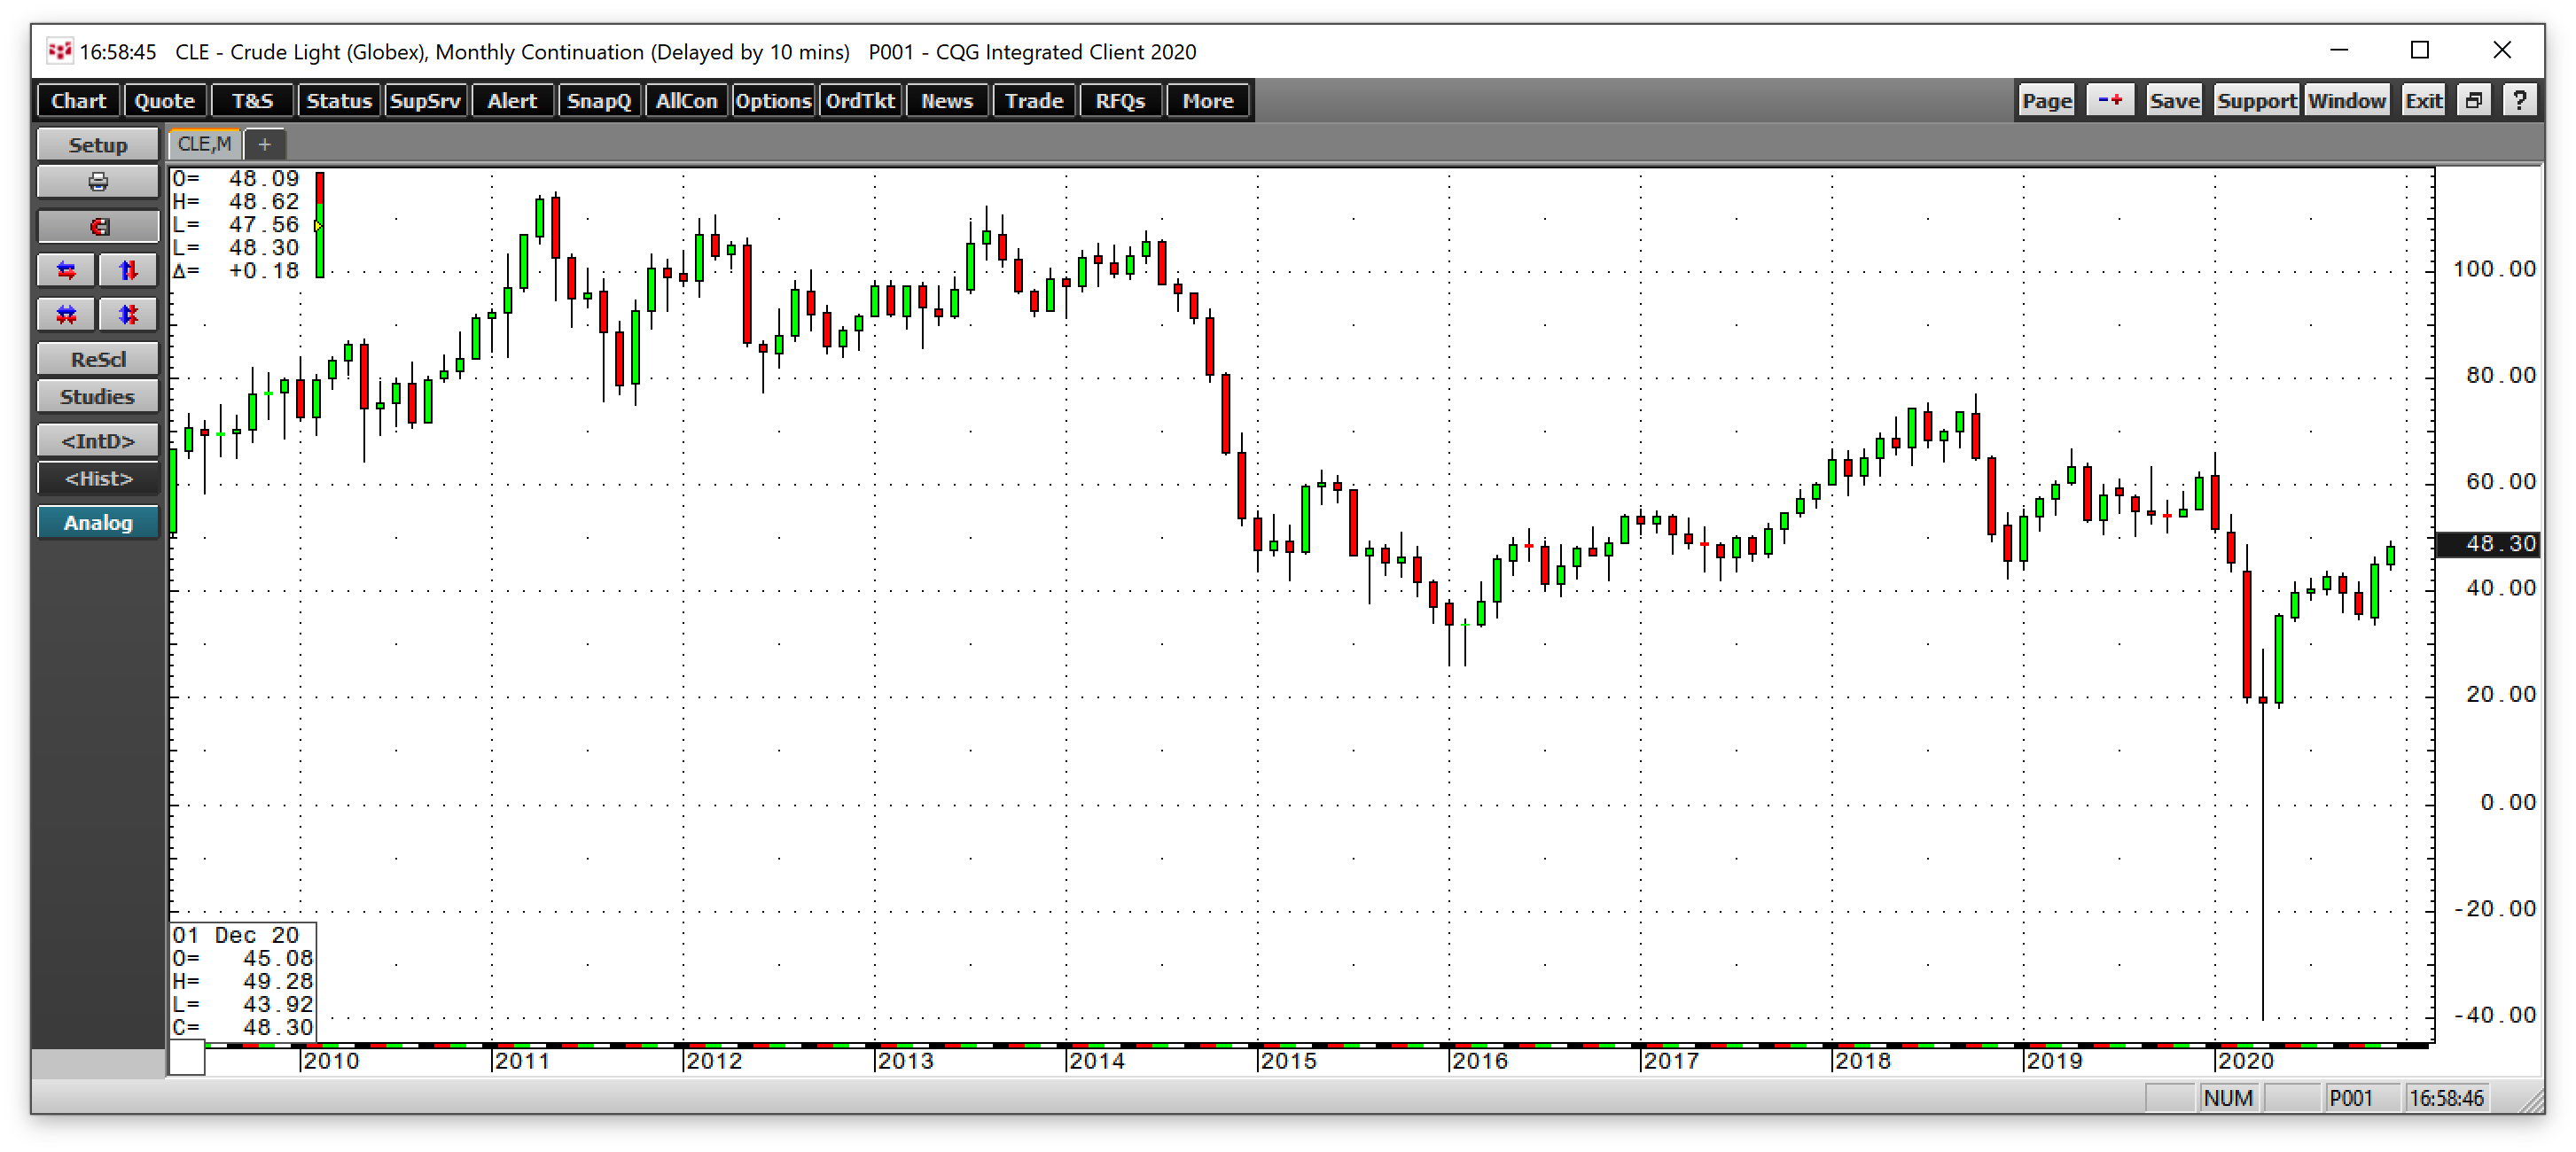
The monthly chart illustrates the decline to negative $40.32 per barrel on the nearby May futures contract on Apr. 20. WTI crude oil fell to an unprecedented level as there was no storage capacity, and those holding long positions had nowhere to store the commodity, forcing them to sell the landlocked oil at any price. Brent crude oil, seaborne petroleum, fell to $16 per barrel on Apr. 20, the lowest price for the European energy benchmark this century.
WTI was trading at the $48.23 per barrel level on Dec. 24, after recovering from the price carnage in April. However, the price was still 21.2% lower than at the end of 2019. Brent crude oil at $51.29 on December 24 was 22.3% lower than its closing price at the end of 2019 at $66 per barrel. Crude oil was taking the stairs higher at the end of 2020, but the price of the energy commodity continues to reflect the weak demand caused by the global pandemic. An end to the virus would likely push crude oil prices higher. Falling US output as energy policy shifts under the incoming Biden administration would also be a bullish factor for the oil market.
Natural gas fell to its lowest price since 1995 in late June. Over the past thirty years, the NYMEX natural gas futures traded from a low of $1.02 to a high of $15.65 per MMBtu. In late June, the price came within 41.2 cents of the low when it fell to $1.432.
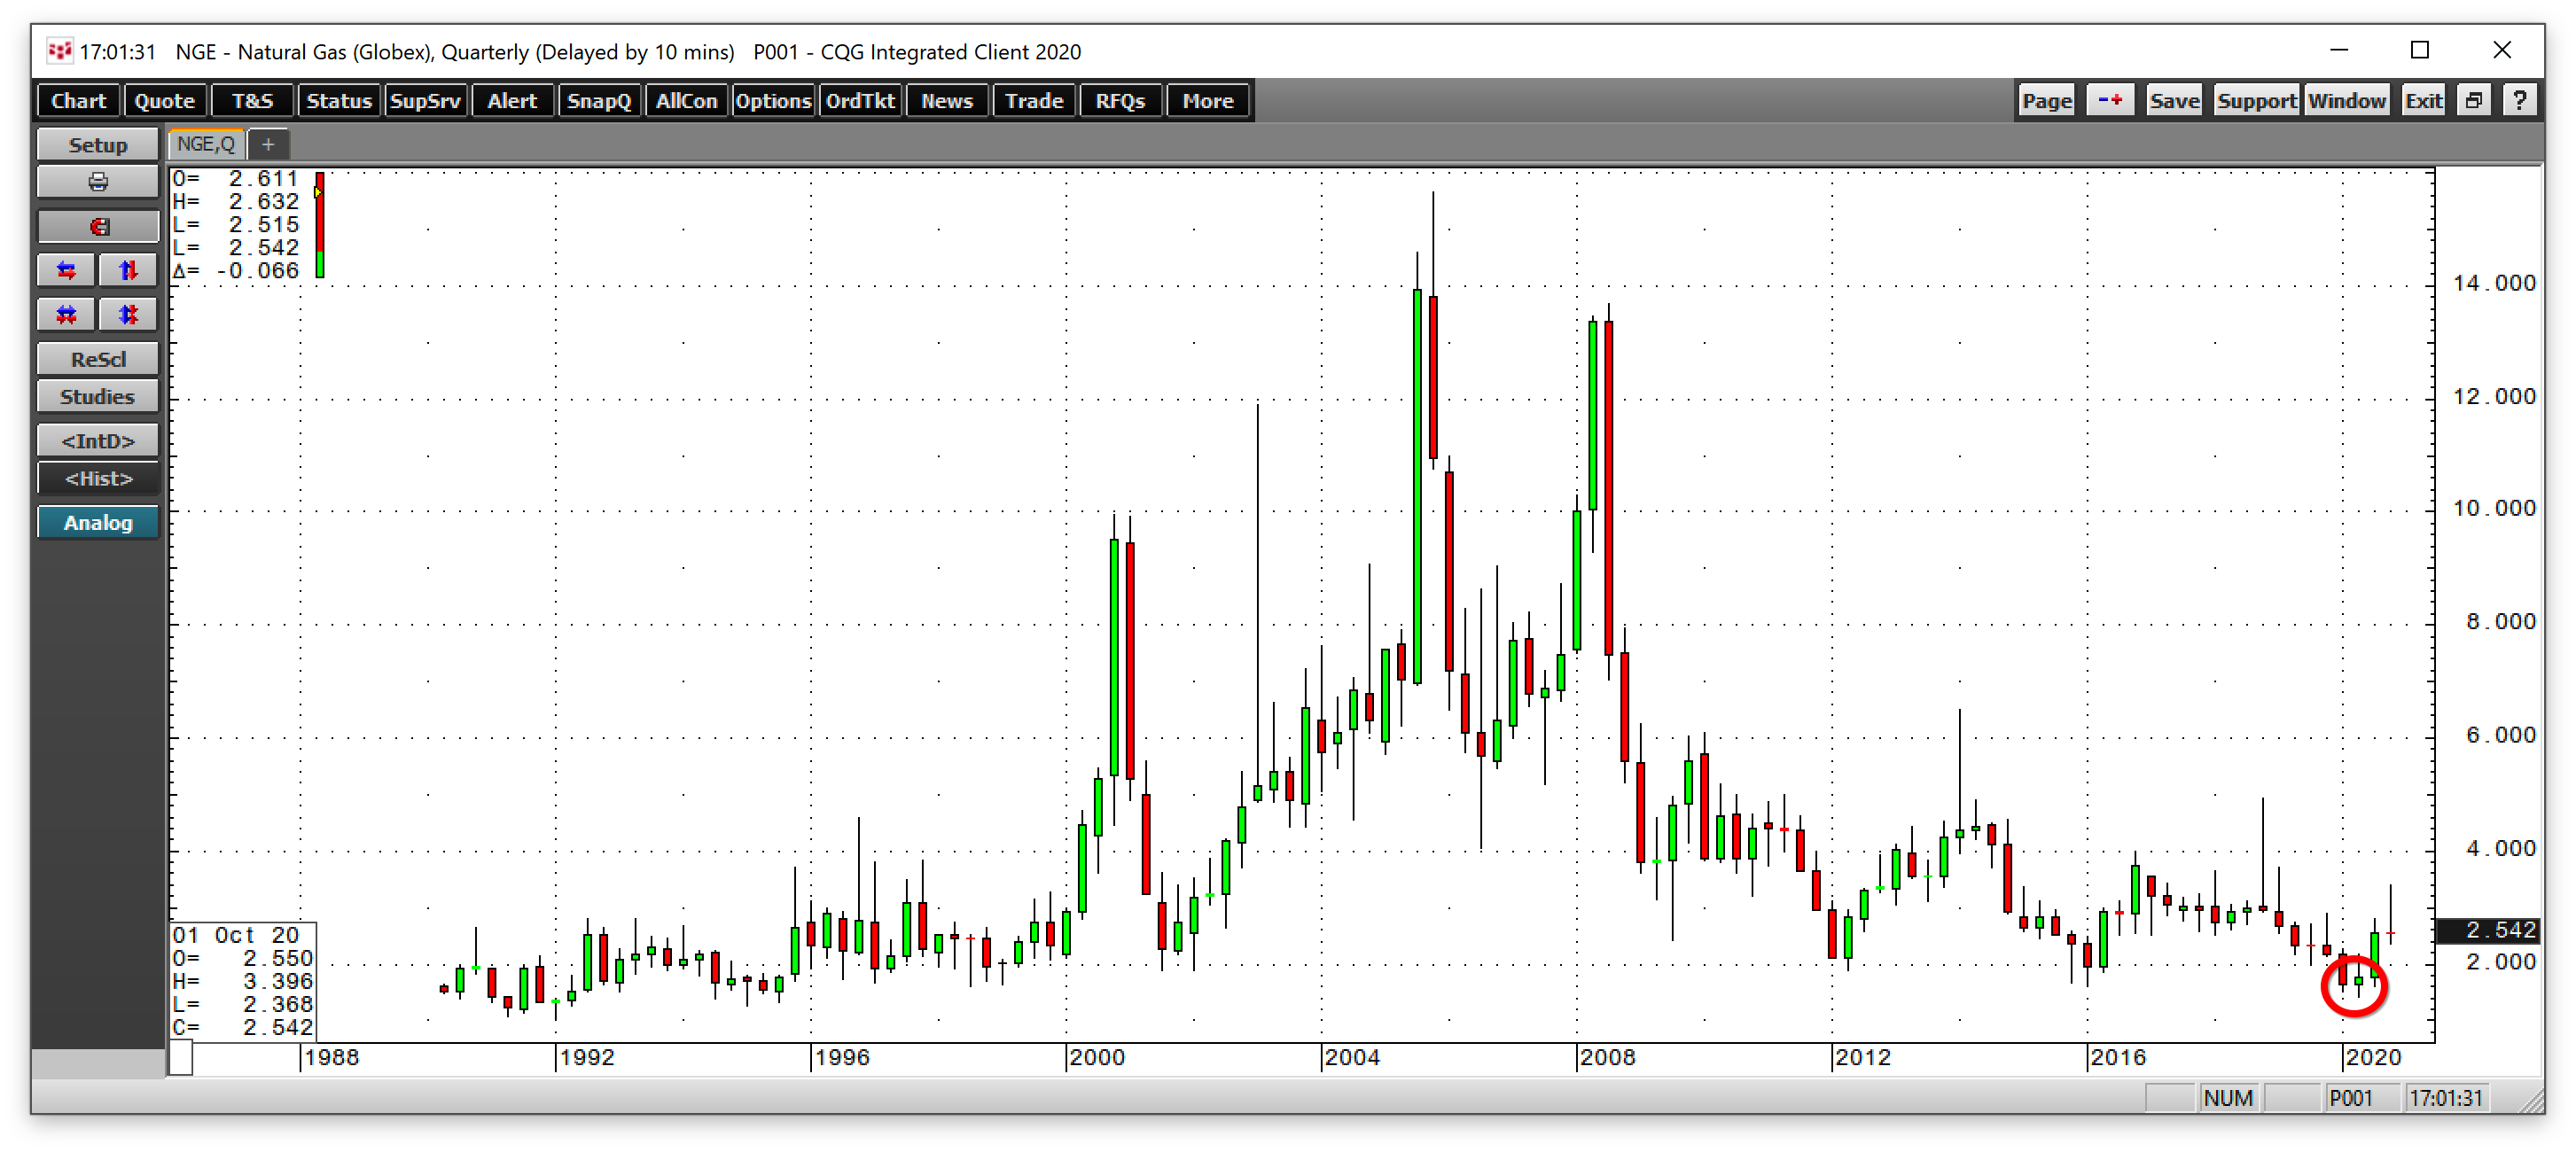
The quarterly chart shows the move to a quarter-of-a-century low in June. In July, Warren Buffett’s Berkshire Hathaway (NYSE:BRKa) announced a $10 billion acquisition of the natural gas transmission and pipeline assets from Dominion Energy (NYSE:D). The purchase increased Berkshire’s control of interstate transmission from 8% to 18%.
Mr. Buffett’s vote of confidence, a series of storms along the Gulf of Mexico, and an early cold blast in late October pushed the nearby NYMEX futures contract’s price to a high of $3.396, the highest level since January 2019. Natural gas closed 2019 at $2.183 and was 15.3% higher on Dec. 24, 2020, at $2.518 per MMBtu. The shift in US energy policy under President-elect Biden is likely to increase regulation, limit fracking, and cause the output to decline, which could be a supportive factor for 2021.
Agricultural commodities take off
Agricultural commodities feed an ever-growing world. The last time grain and oilseed markets experienced a significant rally was in 2012 when drought conditions pushed corn and soybean prices to all-time highs and wheat to $9.4725 per bushel, the second-highest level in history.
Since then, weather conditions have allowed for bumper crops and ample supplies to meet all requirements. However, according to the US Census Bureau, the global population grows by approximately 80 million people each year. Since 2012, there are more than 640 million more mouths to feed, and production must keep pace with the growing demand side of the fundamental equation for food.
Grains and oilseeds are critical ingredients in many food products. Bumper crops have kept soybean, corn, and wheat futures prices low over the past eight years.
During the second half of 2020, grain and oilseed futures prices began to move higher, and they kept on going through the fourth quarter.
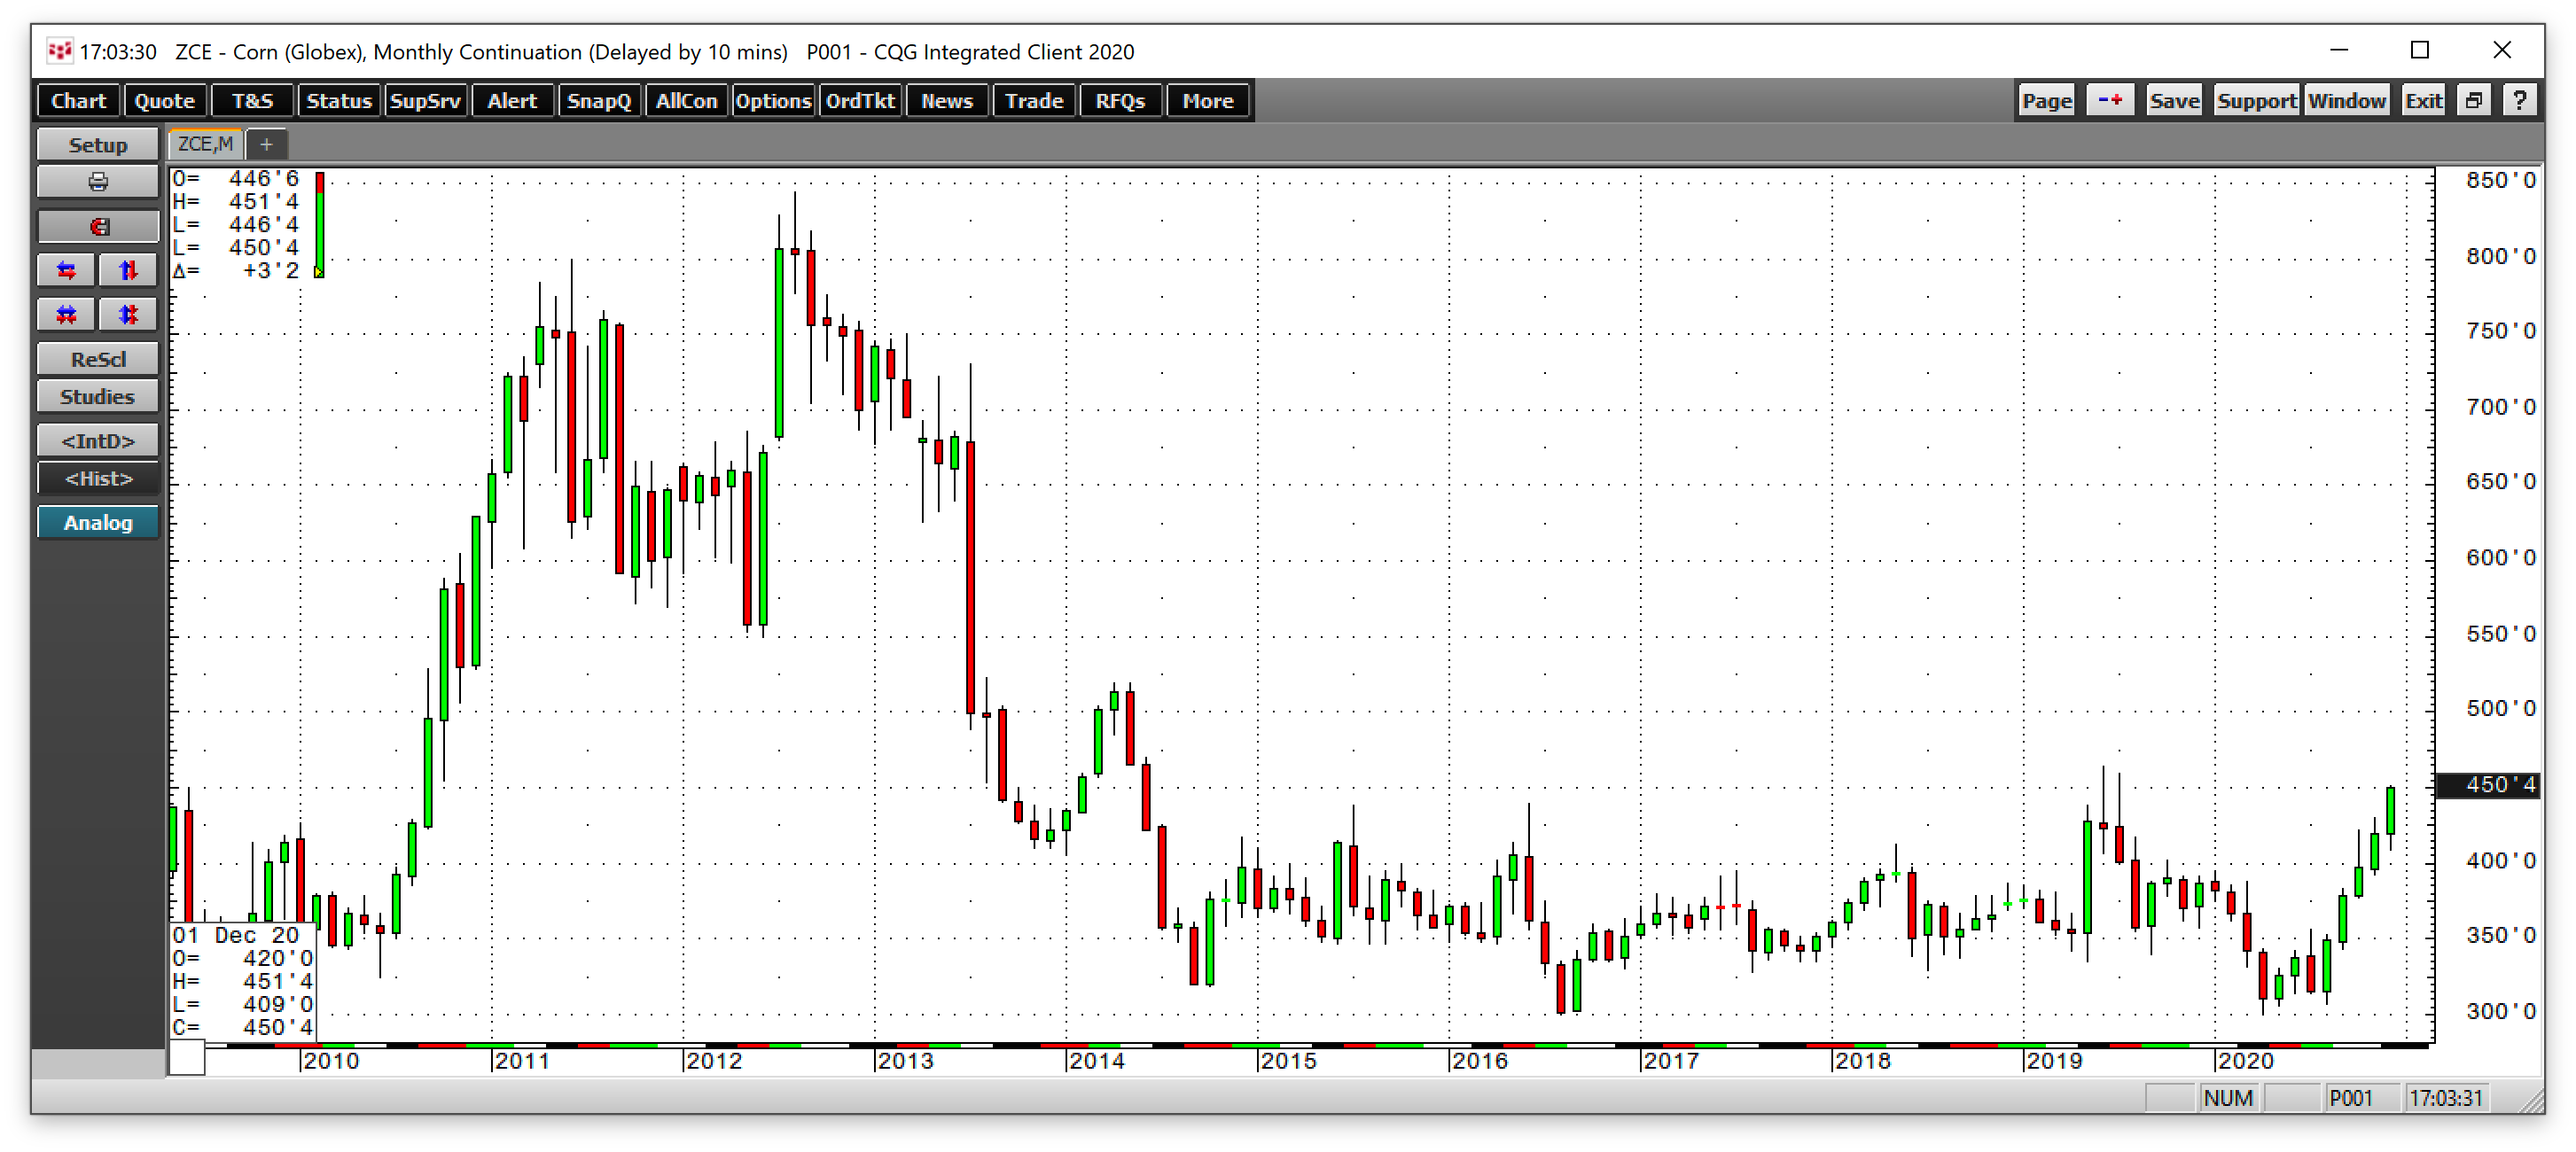
Corn prices posted five consecutive months of gains, pushing the coarse grain price to the $4.505 level on Dec. 24, 16.3% higher than the closing price of $3.8725 at the end of 2019. Corn was trading at its highest price since July 2019 at the end of 2020.
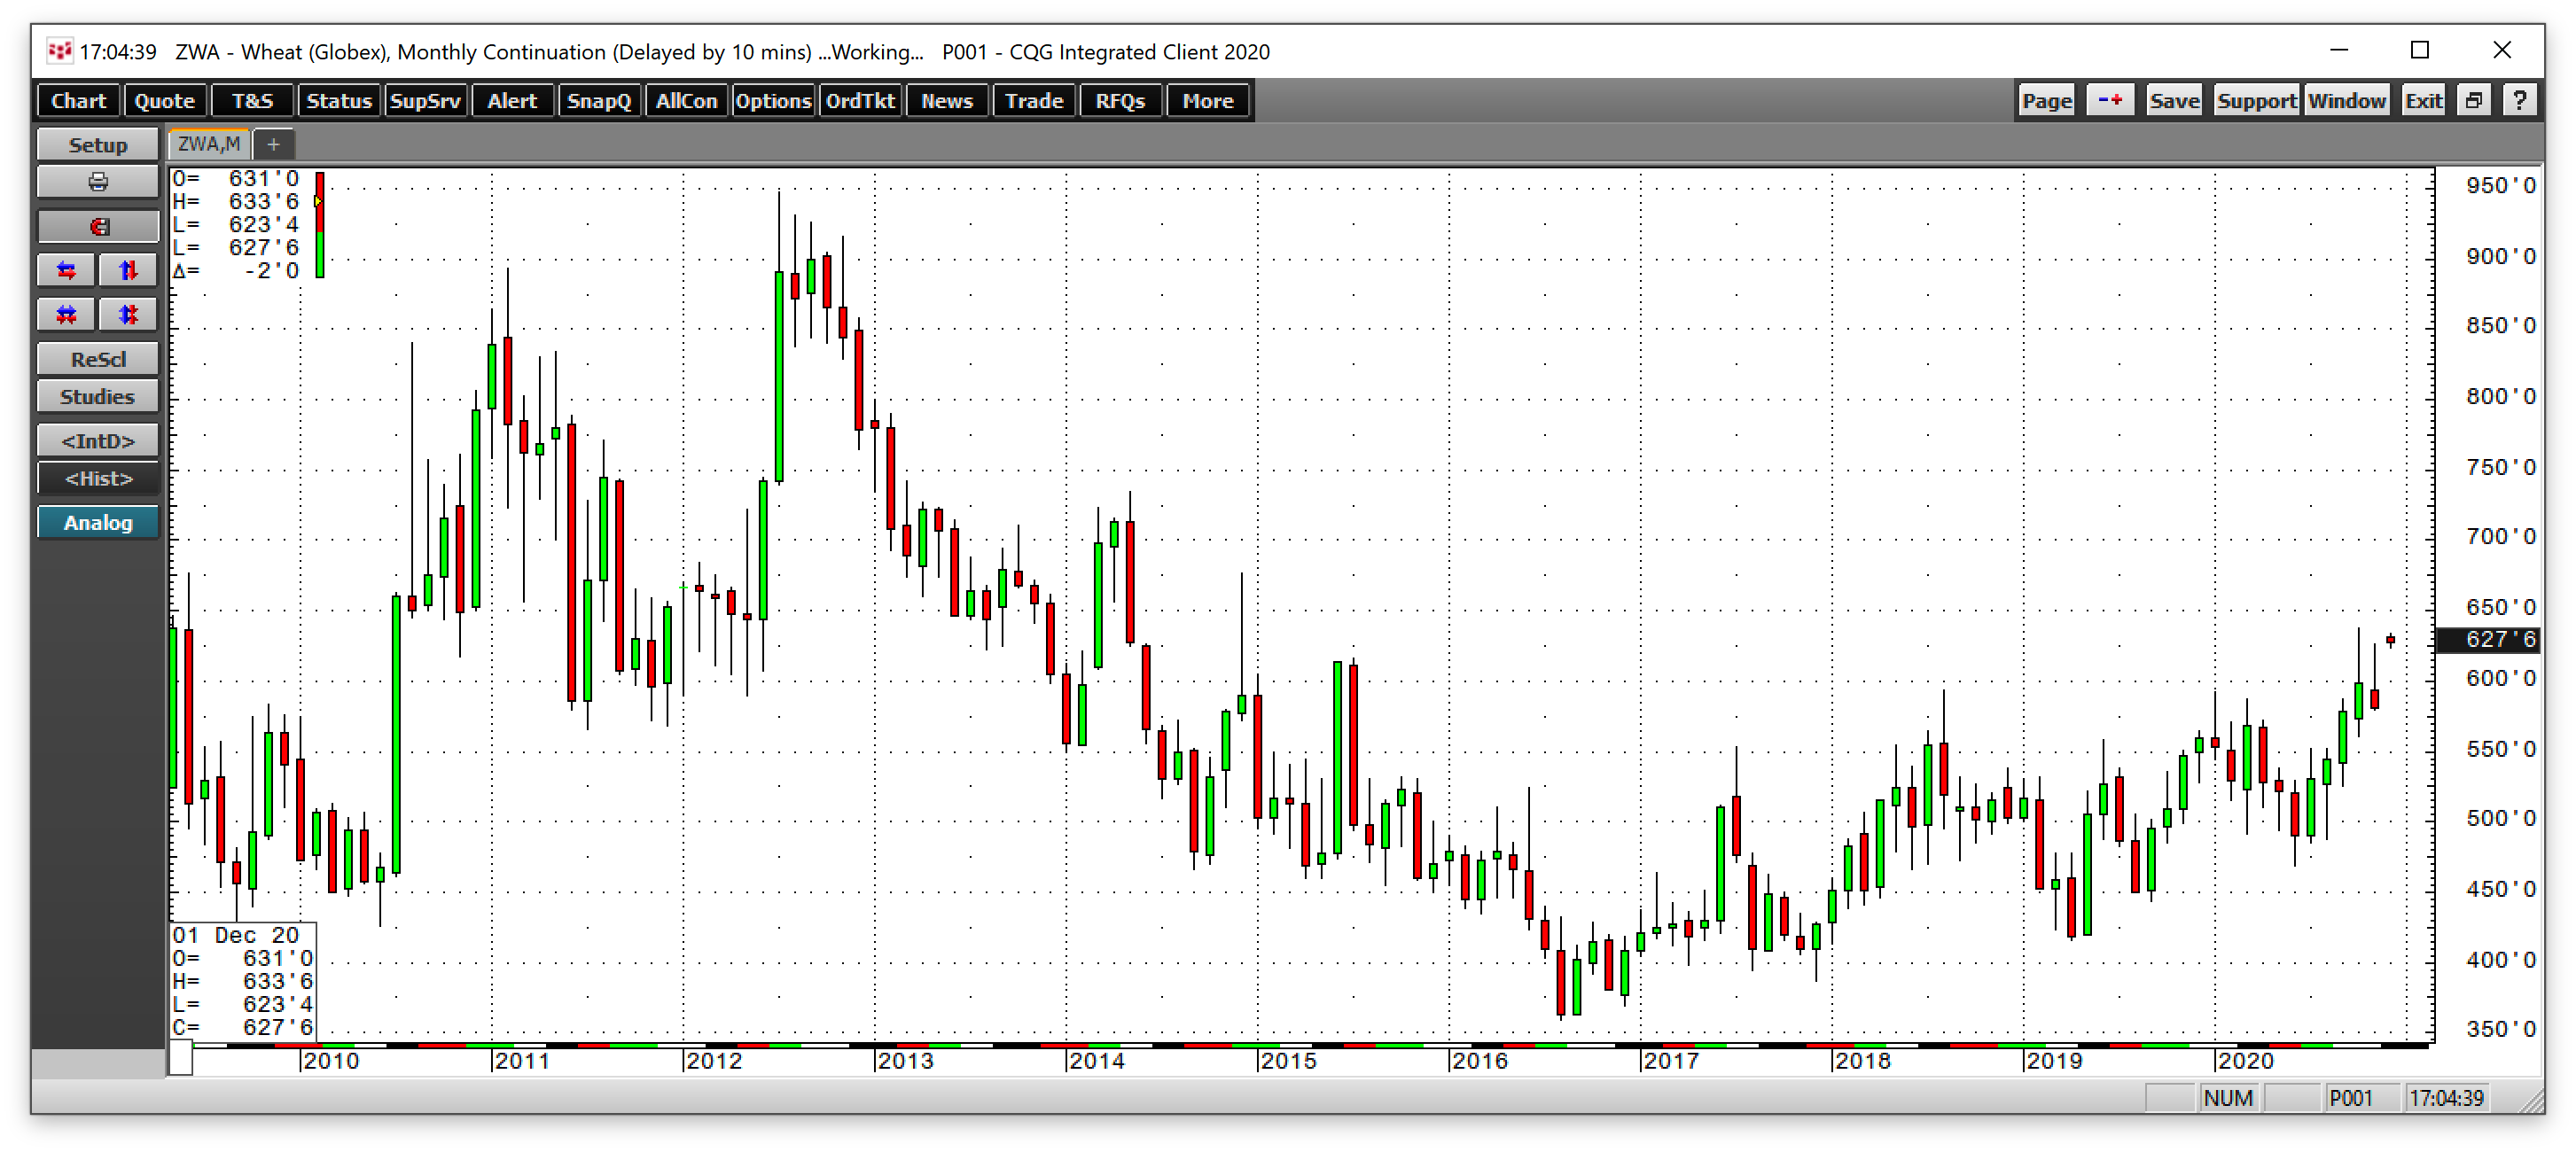
The CBOT wheat futures price rose to a high of $6.3825 per bushel in October, the highest price for the primary ingredient in bread since December 2014. At $6.2775 on Dec. 24, wheat was 12.2% higher than the $5.595 closing price at the end of 2019.
The CBOT soybean futures were trading at the highest price since August 2014 on Dec. 24 at $12.6350 per bushel. The nearby futures contract closed 2019 at $9.4350 and rallied 33.9% from the end of last year.
Grain and oilseed prices were trending higher at the end of 2020. While the weather conditions during the 2021 crop year will determine the price path of the grains and oilseed futures, rising demand puts continuous upside pressure on the agricultural products.
Industrial metals surge
Copper is the leader of industrial commodities. The red metal is a building block for infrastructure worldwide. China is the world’s leading consumer, but the prospects for a massive infrastructure rebuilding package in the United States in 2021, and the following years, could increase the demand for copper and many other base metals and construction materials.
Copper is a member of the sector that tends to be the barometer for the health and wellbeing of the global economy. In March 2020, the copper price fell to its lowest level since 2016 when it traded to a low of $2.0595 per pound. On Dec. 24, the price was at the $3.5585 level, the highest price since February 2013 after trading above the $3.60 level.
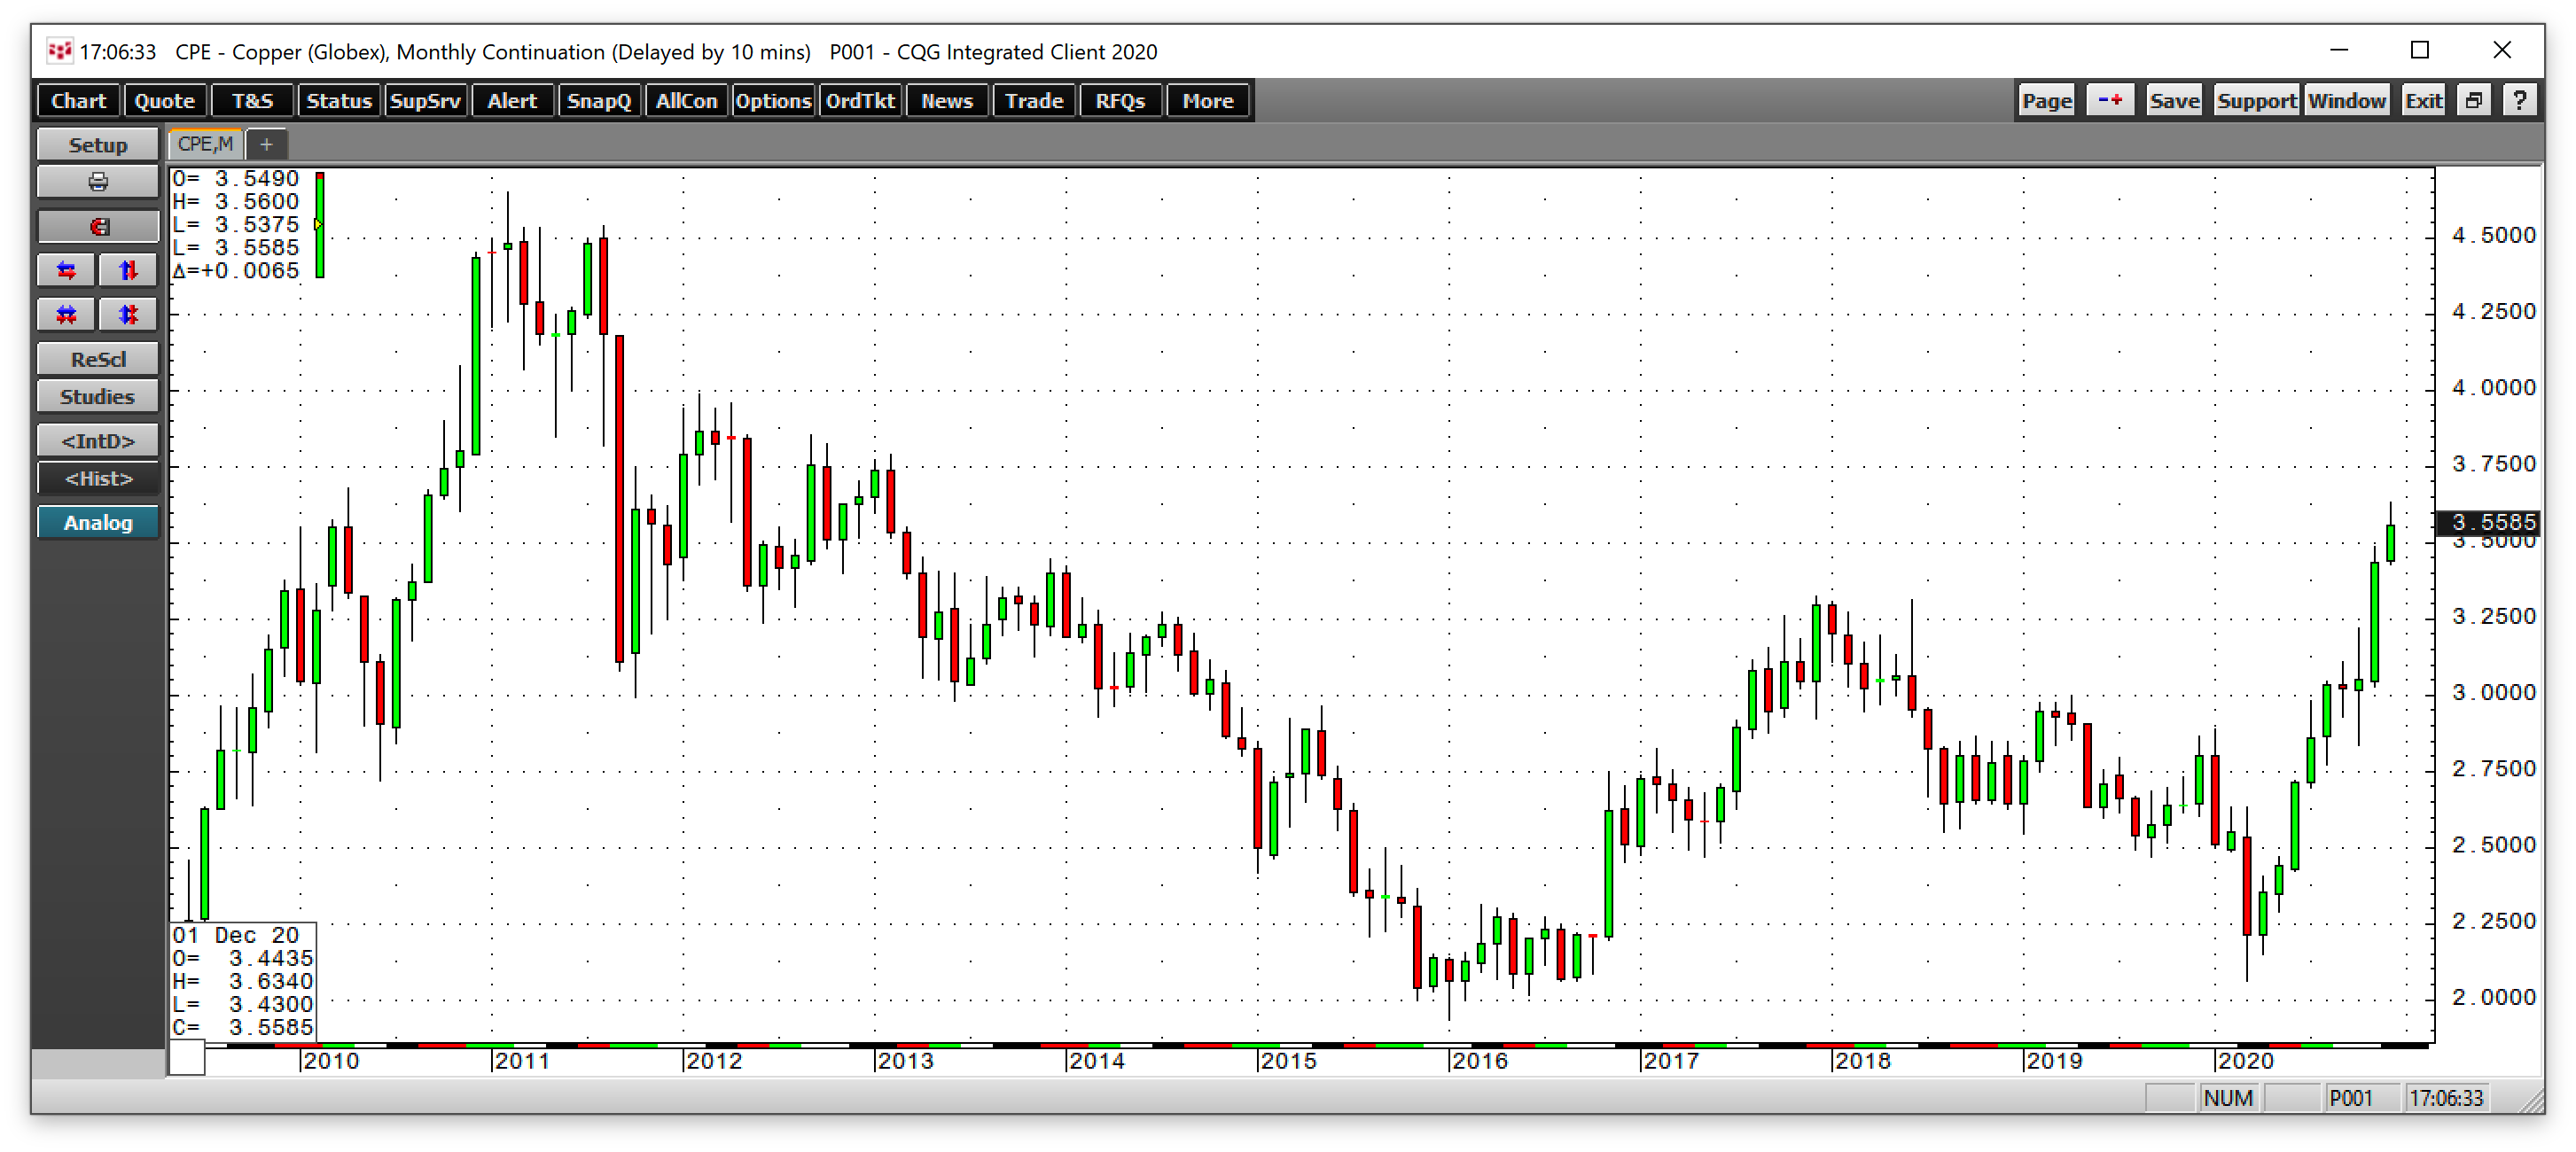
The monthly chart shows that COMEX copper futures closed 2019 at $2.7985 per pound and were 27.2% higher on Dec. 24. The other base metals and materials that trade on the London Metals Exchange, steel, iron ore, lumber, and other commodities required for construction had also moved appreciably higher from the closing levels at the end of 2019 as we head towards the end of 2020.
Three reasons the trends will continue
Commodity prices fell in February and March 2020 on the back of risk-off conditions created by the global pandemic. However, they came storming back with many members of the asset class reaching multi-year, and in some cases, all-time highs.
The prospects are for higher commodity prices in 2021 because of three critical factors:
- The US Federal Reserve told markets to expect short-term rates to remain at zero percent until 2023. The central bank continues to push rates lower further out along the yield curve via quantitative easing or its purchases of $120 billion in debt securities each month. The Fed shifted its 2% inflation target to an average of 2% in 2020, which encourages rising inflation. Low-interest rates and increasing inflation are bullish factors for commodity prices.
- Government stimulus increases the deficit and weighs on the purchasing power of currencies as it increases the money supply. In 2020, the US Treasury borrowed a record $3 trillion. The latest stimulus package at the end of December will necessitate more borrowing in 2021. The price tag for the stimulus and rising money supply is a decline in the dollar’s purchasing power. Since other world central banks and governments follow the United States, the increasing money supply is a global trend, which supports higher commodity prices.
- A falling dollar tends to support higher commodity prices. Since the US dollar is the benchmark pricing mechanism for most commodities, when the dollar falls, it is a sign of a decrease in purchasing power, causing raw material prices to rise.
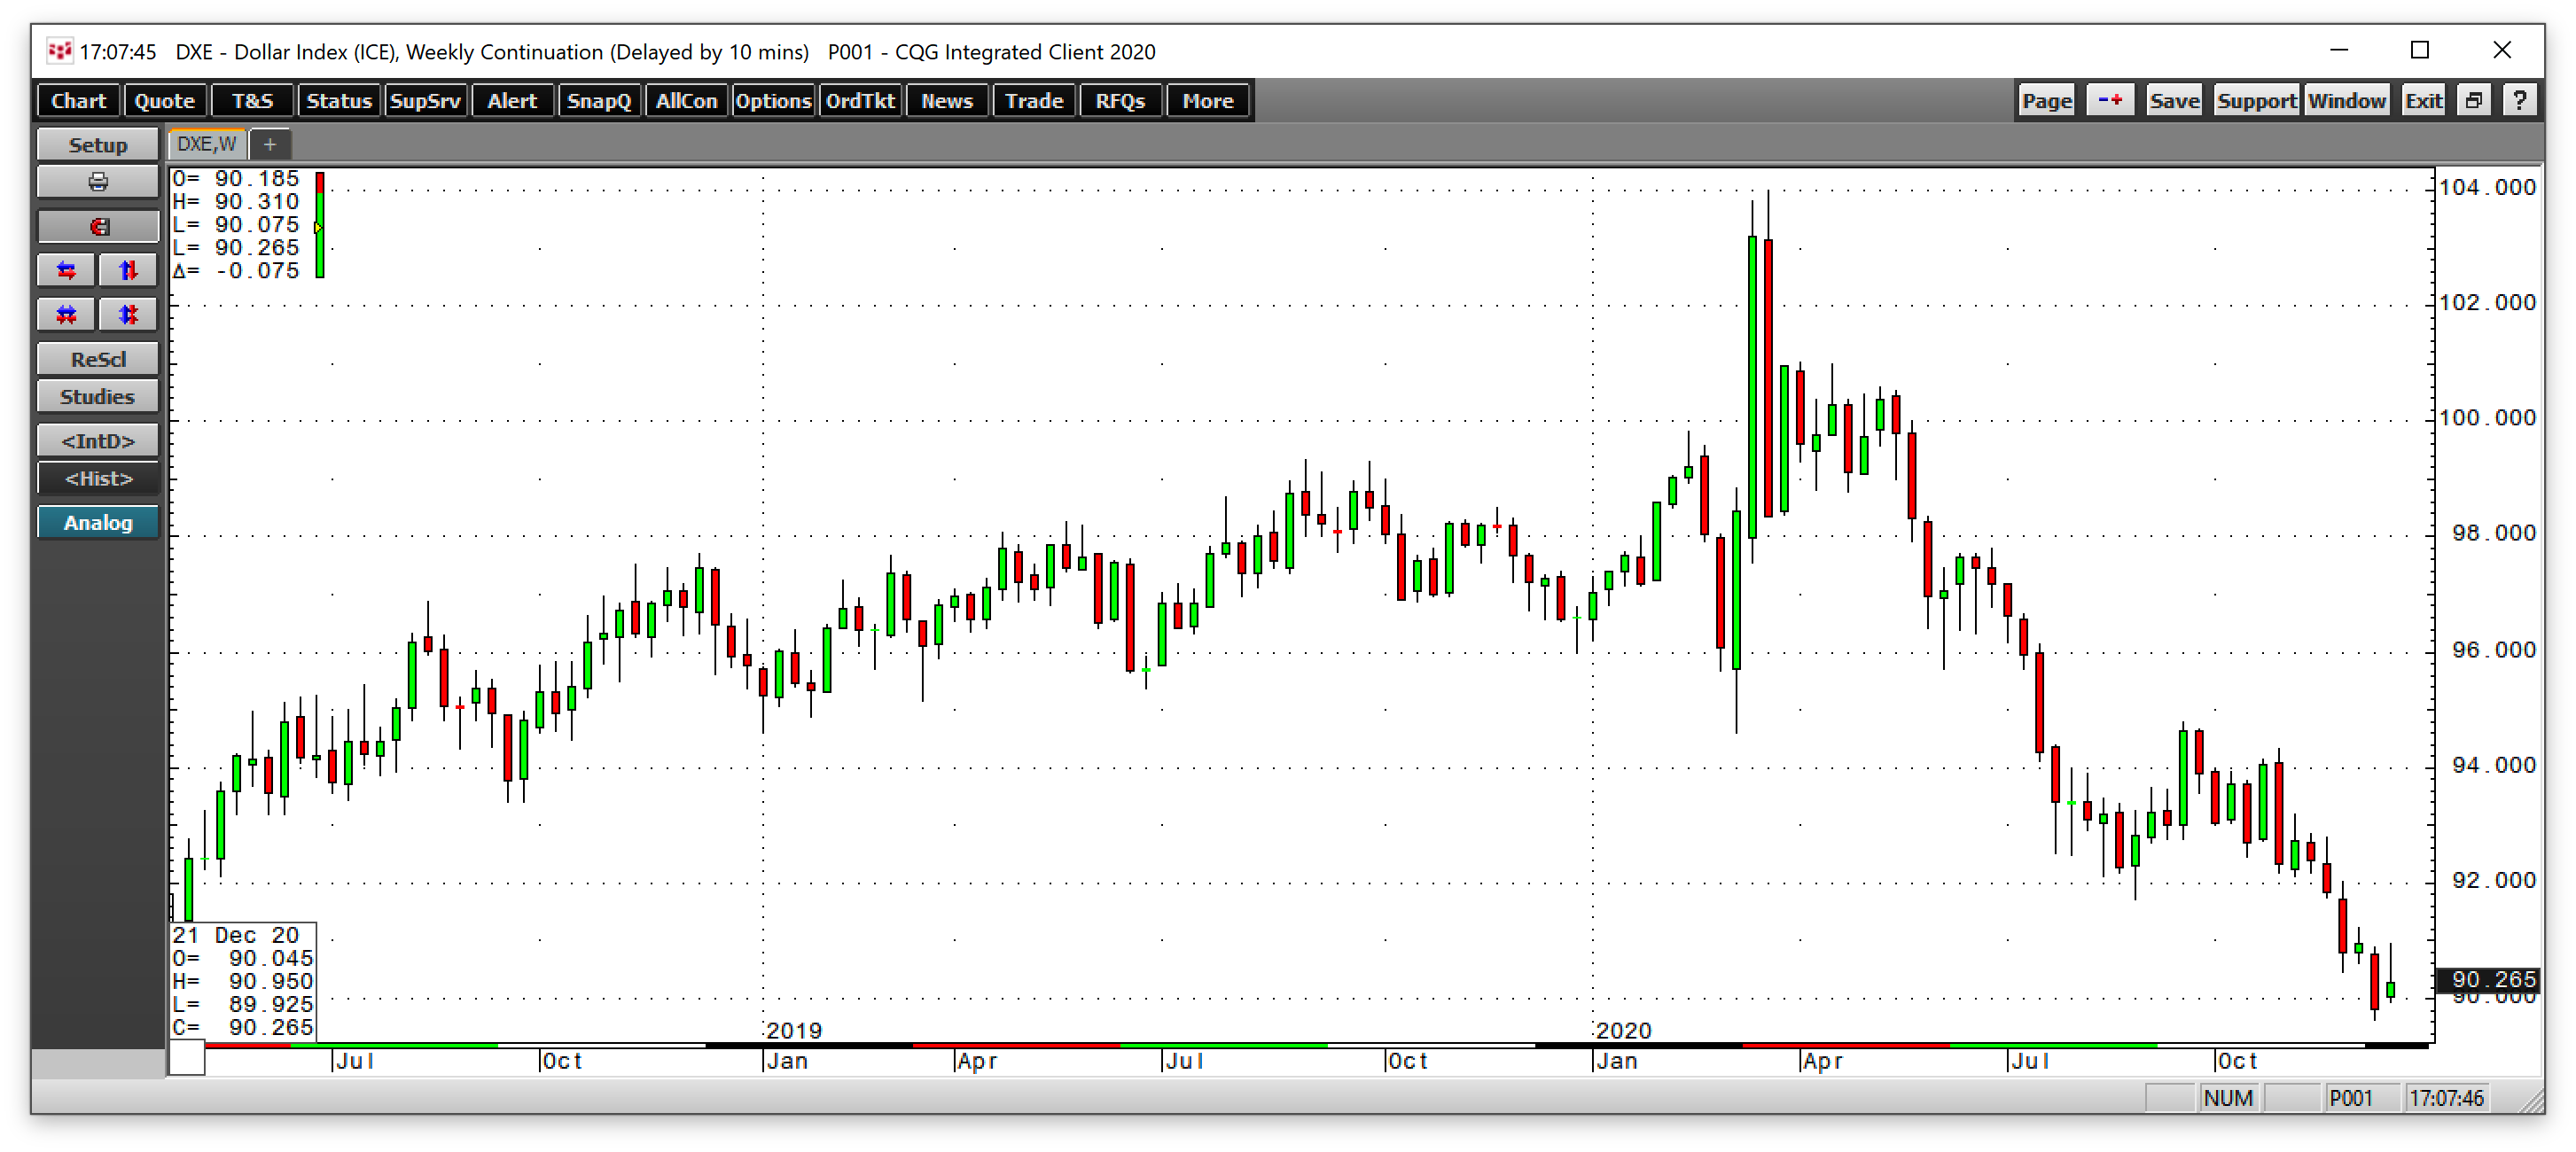
As the chart highlights, the dollar index trend remains lower at the end of 2020, which supports rising commodity prices.
Fiscal and monetary policies ignited rallies in the commodities market in 2020. The policies are similar to those employed in 2008 following the global financial crisis. From 2008 through 2012, the commodities asset class experienced a secular rally that took prices to multi-year or all-time highs.
The only difference between 2008 and 2020 is that the liquidity and stimulus levels are far higher this year than a dozen years ago. If history repeats, 2021 should be a year where the trend of higher commodity prices continues.
Markets rarely move in straight lines, even in the most aggressive bull markets. Buying dips in commodities could be the optimal approach to the asset class in 2021.
