In this stock screen, I use the Benjamin Graham formula, Piotroski F-Scores, analyst price targets and fundamental valuation models to find the ten most attractive stocks on the Nasdaq.
Screen Filters
Ben Graham Formula Upside
The Ben Graham Formula is a simple method for estimating the intrinsic value of a company. It was proposed by Benjamin Graham in his world famous book The Intelligent Investor.
Note the healthy upsides by sector shown in the chart below, which is why I screened for greater than 20% upside.
Piotroski F-Score
Joseph Piotroski, a Stanford professor, developed a set of 9 rules to find companies with strong liquid balance sheets, profitability, and operating ffficiency. Professor Piotroski proposed screening for stocks based on a checklist that awards one point for each matched criterion.
I screened for Piotroski F-Scores greater than 6 -- well above the sector median scores that range from 3 to 5.
Upside (Analyst Target)
Analysts at investment banks and equity research firms release price targets for stocks. Upside (Analyst Target) compares the current stock price to the analyst price target.
I screened stocks with an analyst upside greater than 20% to find companies analysts are most bullish on.
Upside (Finbox.io)
Upside (finbox.io) compares a company's current stock price to it's finbox.io Fair Value estimate.
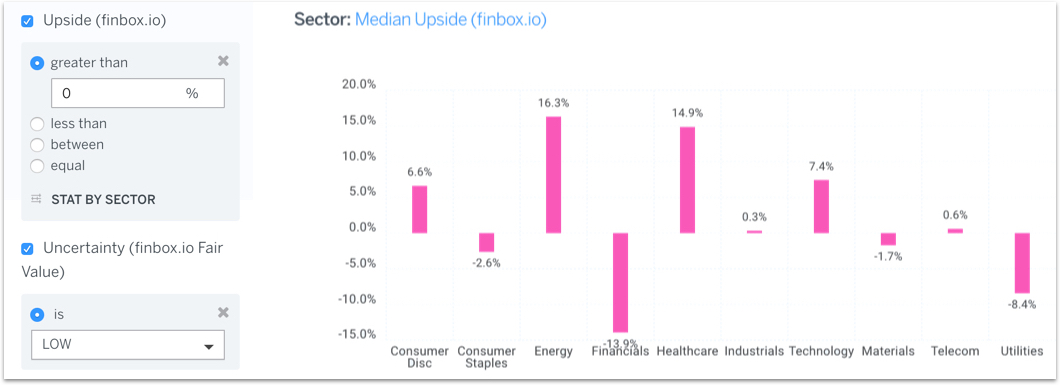
I screened stocks with a finbox.io upside greater than 0% and a low uncertainty rating. Notice how the median finbox.io upsides below aren’t as rosy as the analyst upsides above. This isn’t surprising as analysts are often incentivized to publish optimistic research in order to cross sell other service lines.
Screen Results
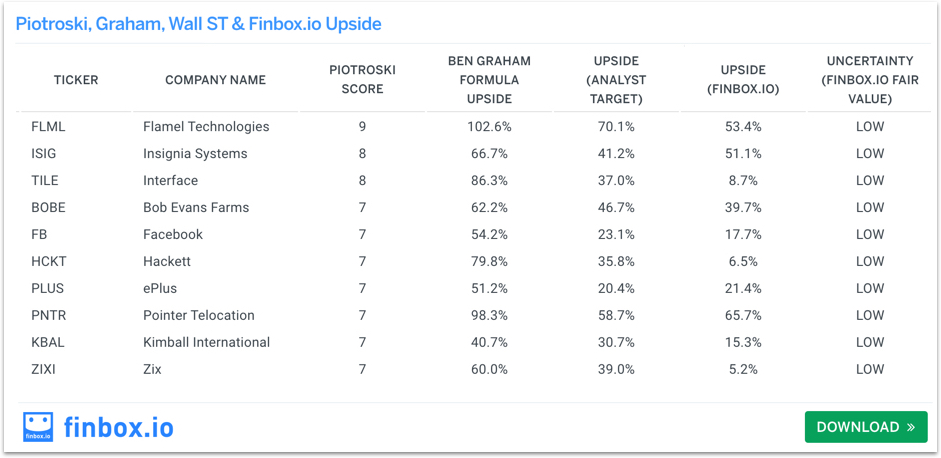
At the time of running the screen, there were only 10 stocks that fit the above filters:
View the latest screen results here.
- Flamel Technologies (NASDAQ:FLML)
- Insignia Systems (NASDAQ:ISIG)
- Interface (NASDAQ:TILE)
- Bob Evans Farms (NASDAQ:BOBE)
- Facebook (NASDAQ:FB)
- Hackett (NASDAQ:HCKT)
- ePlus (NASDAQ:PLUS)
- Pointer Telocation (NASDAQ:PNTR)
- Kimball International (NASDAQ:KBAL)
- Zix (NASDAQ:ZIXI)
Conclusion
A portfolio constructed with these 10 stocks (weighted equally) would have provided a 10-year return of 472%, a 5-year return of 177% and a 3-year return of 67%. However, the portfolio would have returned -3% over the last year - well below that of the broader market as shown in the charts below.
Investors may want to take a closer look at these names. Don’t expect them to stay undervalued for long as share prices eventually catch up to fundamentals.
