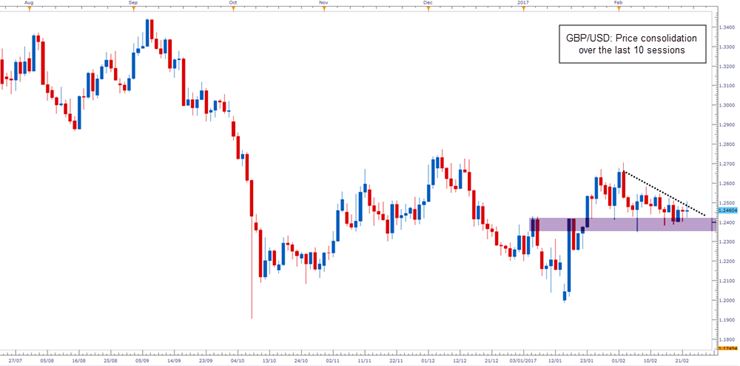
When prices are compressing and consolidating for a significant period of time, statistical tendency generally dictates that a period of price expansion will follow. The longer that period of price consolidation, the stronger the breakout should be. The daily cable chart stands out like a shining beacon in this regard.

Over the last 10 days, we have seen key UK economic data that has disappointed expectations but failed to move sterling out of its current zone of $1.24 - $1.25. Chiefly, weaker-than-expected inflation figures pushed the market to the most recent lows around 1.2383. Interestingly, sterling was trading close to three day highs prior to this at 1.2540. However, most importantly, February’s low of 1.2352 was not troubled on the downside.
We have also had an unexpected slowdown in wage growth – one of the crucial pieces of data that the Bank of England is looking at, and which Carney highlighted on Tuesday. This weaker figure was backed up by poor retail sales, which potentially show that longer-term, consumer purchasing power will be squeezed even harder as the labor market softens and inflation moves above earnings growth.
Stateside, we have also seen slightly baffling price action after a number of events that would ordinarily drive dollar strength. We have had top tier US data, an upcoming ‘phenomenal’ tax plan and a surprisingly hawkish Yellen, implying that a March rate hike is still on the table.
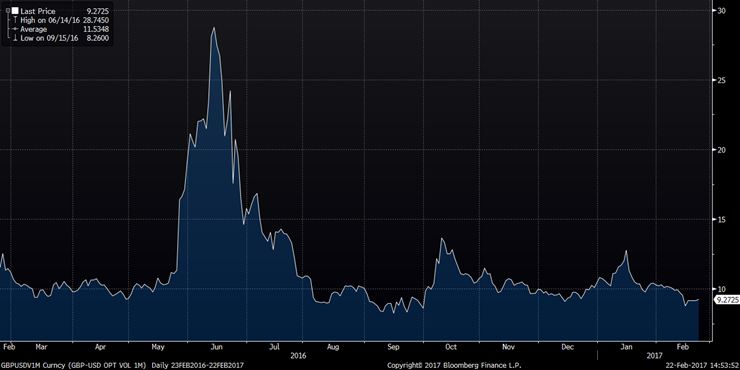
Yet, with this plethora of data and information, cable is still on track to close-in on the $1.24-$1.25 zone (with minor moves outside) for a tenth session, with one exception. This period of calm is clearly evident in the chart below -- the 1-month implied volatility of GBP/USD, which is near multi-month lows.

Of course, we have not mentioned the ‘B’ word, which will be front and center in a few weeks once the uncertainty of Article 50 is triggered. Until then, we are very much in a holding pattern. The commonly watched 55-day and 100-day moving averages sit at 1.2405-1.2413. Strong resistance stands at 1.2580, so as long as this holds, it would be wise to fade rallies.
With Carney seemingly in no rush to react to the inflation push, Yellen and President Trump’s upcoming fiscal plans may force a change in the market structure in the next week or so. Regardless, the breakout should be a strong one.
