Coal stocks continue to steadily emerge from a brutal bear market over the past 2 years. Last week Market Vectors' Coal ETF (KOL) broke above its 30-week moving average for the first time since early 2012.
As you can see on the chart below, KOL has been declining below this moving average in a Stage 4 decline since August 2011. If KOL can continue to move higher above the 30-week moving average it will transition into a Stage 2 uptrend.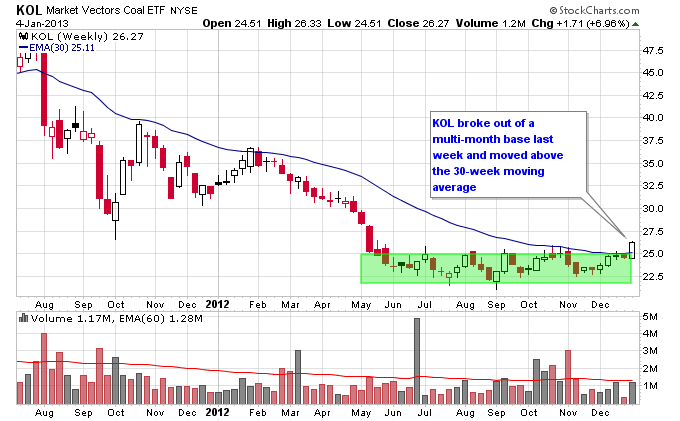
Looking at a daily chart of KOL, a couple of things stand out. First, the RSI has consistently stayed above 40 since September, even during pullbacks. This is typically the sign of an emerging uptrend since KOL is failing to get too oversold when it pulls back.
Next, the action in October was encouraging as volume started to increase when KOL started to approach resistance around the 25-26 area. Things changed quickly though after the re-election of President Obama, which was perceived to be a negative for the coal market.
A wave of selling hit the coal sector right after the election and caused a big gap down in KOL. It continued to sell down to about 23, but instead of continuing lower, found support there that has held since June 2012.
KOL started to move higher once again in December. KOL gapped higher to start 2013 and each of the 3 trading days in 2013 have seen above average volume, which is a good sign for a breakout.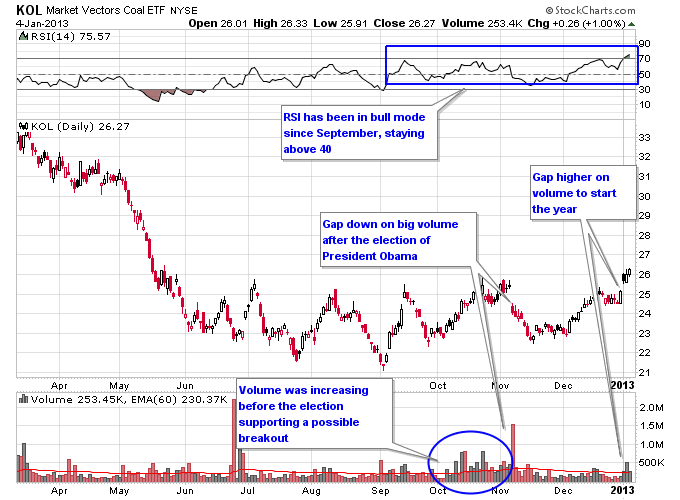
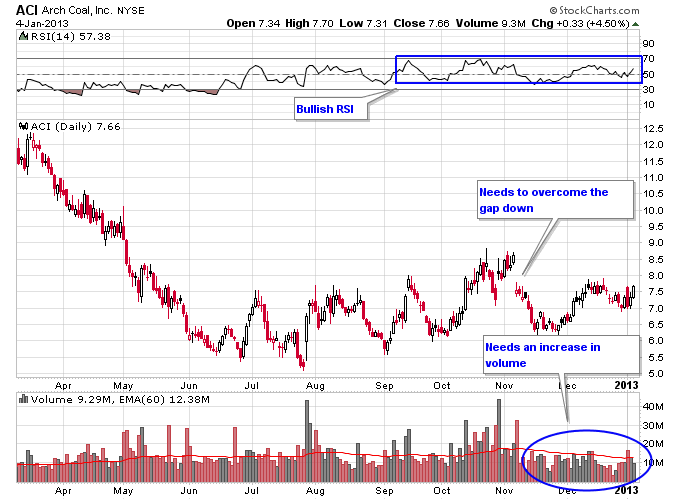
Next let’s look at some individual coal stocks. Most coal stocks are lacking one key ingredient for a breakout, which is an increase in volume. Just like the KOL ETF, individual coal stocks saw increasing volume in October, but have seen limited buying pressure since the gap down after the presidential election. These stocks need to see buying pressure to overcome the gap down resistance and to transition into sustained uptrends.
Peabody Energy (BTU) and Arch Coal (ACI) are two examples of coal stocks below their election gap downs. Both have established a pattern of higher lows and have bullish RSI readings, but need volume to move past their gap down levels.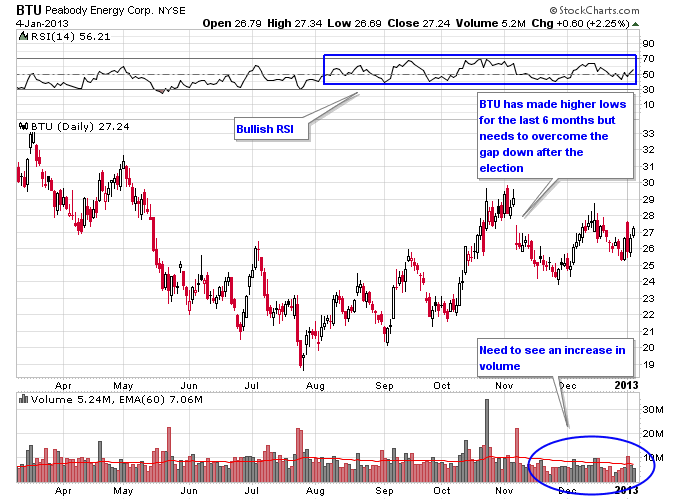
Alpha Natural Resources (ANR) has overcome its gap down from the election, and has seen a little more buying pressure than BTU and ACI.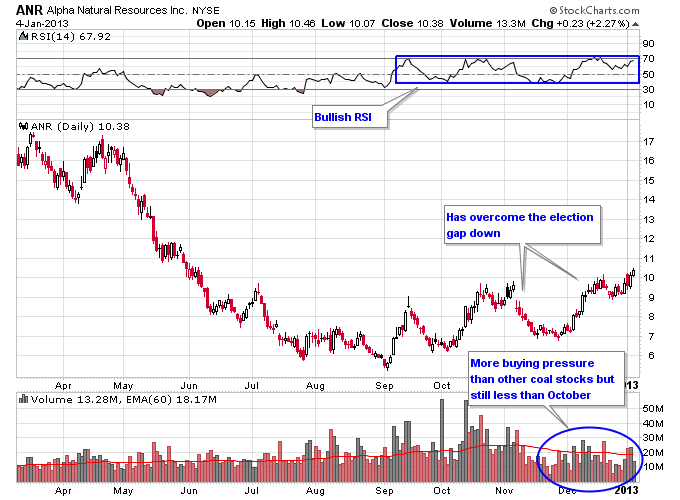
As 2012 came to a close and during the start of 2013 the market has seen some sectors that were crushed over the past 2 years move substantially higher. This includes solar stocks, steel stocks, and some major commodity producers. The coal sector looks poised to continue rallying but needs more volume to come into the sector, otherwise the chances of the rally continuing are diminished. In particular, watch how the sector trades as a whole as time moves forward. The best scenario for a sustained uptrend would be to see increased volume across the board in individual coal stocks as well as the KOL ETF.
Disclosure: Long ANR
- English (UK)
- English (India)
- English (Canada)
- English (Australia)
- English (South Africa)
- English (Philippines)
- English (Nigeria)
- Deutsch
- Español (España)
- Español (México)
- Français
- Italiano
- Nederlands
- Português (Portugal)
- Polski
- Português (Brasil)
- Русский
- Türkçe
- العربية
- Ελληνικά
- Svenska
- Suomi
- עברית
- 日本語
- 한국어
- 简体中文
- 繁體中文
- Bahasa Indonesia
- Bahasa Melayu
- ไทย
- Tiếng Việt
- हिंदी
Coal Stocks Grinding Higher
Published 01/07/2013, 12:30 AM
Updated 07/09/2023, 06:31 AM
Coal Stocks Grinding Higher
Latest comments
Install Our App
Risk Disclosure: Trading in financial instruments and/or cryptocurrencies involves high risks including the risk of losing some, or all, of your investment amount, and may not be suitable for all investors. Prices of cryptocurrencies are extremely volatile and may be affected by external factors such as financial, regulatory or political events. Trading on margin increases the financial risks.
Before deciding to trade in financial instrument or cryptocurrencies you should be fully informed of the risks and costs associated with trading the financial markets, carefully consider your investment objectives, level of experience, and risk appetite, and seek professional advice where needed.
Fusion Media would like to remind you that the data contained in this website is not necessarily real-time nor accurate. The data and prices on the website are not necessarily provided by any market or exchange, but may be provided by market makers, and so prices may not be accurate and may differ from the actual price at any given market, meaning prices are indicative and not appropriate for trading purposes. Fusion Media and any provider of the data contained in this website will not accept liability for any loss or damage as a result of your trading, or your reliance on the information contained within this website.
It is prohibited to use, store, reproduce, display, modify, transmit or distribute the data contained in this website without the explicit prior written permission of Fusion Media and/or the data provider. All intellectual property rights are reserved by the providers and/or the exchange providing the data contained in this website.
Fusion Media may be compensated by the advertisers that appear on the website, based on your interaction with the advertisements or advertisers.
© 2007-2024 - Fusion Media Limited. All Rights Reserved.
