
Shares of CME Group Inc. (NASDAQ:CME) gained 1.3% in the last trading session after the company reported a record average daily volume (ADV) for February. ADV of record of 27.3 million contracts per day expanded 48% year over year. The company witnessed an increase in ADV across all the six product lines.
Options volume improved 29% year over year to average 6.1 million contracts per day with electronic options having soared 76% year over year and averaged at 3.8 million contracts per day.
Metals volume of 0.7 million contracts per day expanded 32% whereas Energy volume of 2.8 million contracts climbed 13%. Interest rate volume of 15.8 million contracts per day surged 50% while Foreign exchange volume improved 42% to about 1.1 million. Moreover, Agricultural volume of about 2 million contracts per day increased 29% year over year and Equity index volume of 4.9 million also skyrocketed 93%.
CME Group’s improving volumes are driven by a solid operating leverage, helping it maintain an enormous market share. The company holds about 90% market share of the global futures trading and clearing services. Expansion of futures products in the emerging markets plus an increase in non-transaction related opportunities and OTC offerings should continue to modestly improve the top line in the years ahead. Efforts to expand and cross-sell through strategic alliances, acquisitions, new product initiatives as well as global presence should also drive the stock.
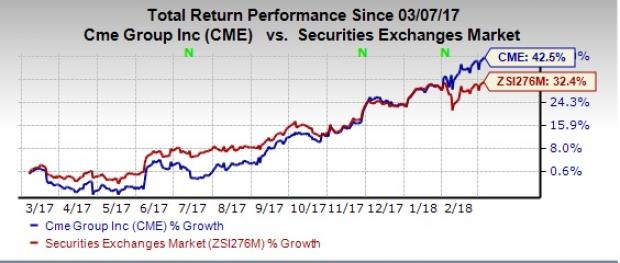
Shares of CME Group have outperformed the industry in a year. While the stock has surged 42.5%, the industry has registered a 32.4% rise.
CME Group carries a Zacks Rank #3 (Hold). You can see the complete list of today’s Zacks #1 Rank (Strong Buy) stocks here.
Recently, securities exchanges namely MarketAxess Holdings Ltd. (NASDAQ:MKTX) , Intercontinental Exchange, Inc. (NYSE:ICE) and Cboe Global Markets, Inc. (NASDAQ:CBOE) have reported respective February volumes.
While Cboe Global Markets’ ADV of 10.6 million contracts for the month soared nearly 44.5% year over year, Intercontinental Exchange’s average daily volume improved 15.8% year over year to 6.7 million contracts. Finally, MarketAxess has reported a trading volume of $157.8 billion during the period.
Wall Street’s Next Amazon (NASDAQ:AMZN)
Zacks EVP Kevin Matras believes this familiar stock has only just begun its climb to become one of the greatest investments of all time. It’s a once-in-a-generation opportunity to invest in pure genius.
Intercontinental Exchange Inc. (ICE): Free Stock Analysis Report
CME Group Inc. (CME): Free Stock Analysis Report
CBOE Holdings, Inc. (CBOE): Free Stock Analysis Report
MarketAxess Holdings, Inc. (MKTX): Free Stock Analysis Report
Original post
Zacks Investment Research