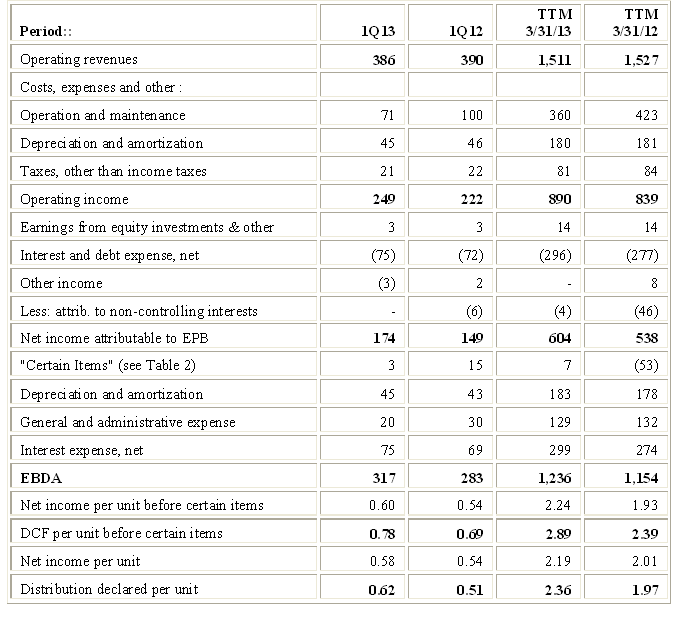
On April 17, 2013, El Paso Pipeline Partners, L.P. (EPB) reported its financial results for 1Q13. Given quarterly fluctuations, trailing 12 months (“TTM”) revenues, expenses, net income and other items affecting Distributable Cash Flow (“DCF”) should be reviewed in addition to the quarterly numbers. Therefore Table 1 below adds TTM numbers to certain key items reported by EPB for 1Q13 and 1Q12:

The lack of revenue growth is troubling. In fact, revenues contracted despite full period contributions by Colorado Interstate Gas Company, L.L.C. (“CIG”) and Cheyenne Plains Investment Company, L.L.C., which owns Cheyenne Plains Gas Pipeline Company, L.L.C. (“CPG”). On May 24, 2012, EBD acquired the remaining 14% interest in CIG and 100% of CPG; thus, results for 1Q12 exclude contributions from CIG and CPG operations and results for the TTM ending 3/31/12 exclude ~2 months of contributions from CIG and CPG.
Net income improved on reduced operations and maintenance costs. Maintenance capital expenditures continue to be much lower than they were when EPB was part of El Paso Corp. Hopefully the lower levels reflect careful pruning of maintenance expenditures and corners are not being cut.
Management assesses segment performance based on “EBDA”, a metric defined as earnings before depreciation and amortization, certain general and administrative (“G&A”) expenses and interest expense. These certain G&A expenses include employee benefits, legal, information technology and other costs that are not deemed controllable by operating management and thus are not included in the measure of performance for which each segment is accountable. Many master limited partnerships {“MLPs”) use their own unique performance measure (EPB is no different in that sense) which makes comparison across MLPs difficult.
While EBDA improved by 12% in 1Q13 and by 9% in the TTM ending 3/31/13 compared to the prior year periods, this is in large part due to the full period contributions by CIG and CPG noted above.
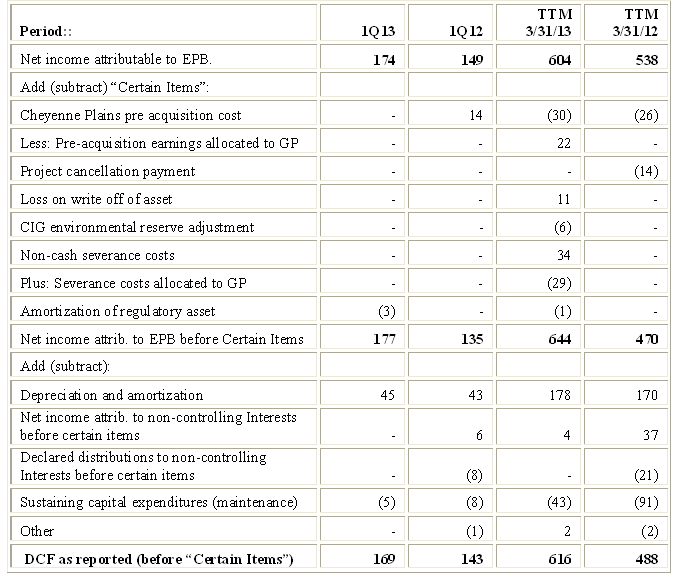
My analysis of sustainable DCF will be completed after EPB provides additional cash flow information as part of its 10-Q filing expected shortly. Table 2 below adds TTM numbers to EPB’s April 18 press release which provides a reconciliation of net income to reported DCF for 1Q13 and 1Q12:

Table 2 reflects the fact that, having become a Kinder Morgan company, EPB now follows the method used by Kinder Morgan Energy Partners LP (KMP) to determine DCF. This method is detailed in an article titled Distributable Cash Flow (“DCF”) which also provides a comparison to definitions used by other MLPs. I find KMP’s method (now also EPB’s method) of deriving DCF (what these partnerships refer to as “DCF before certain items”) complex. It also differs considerably from the method used by other MLPs I have covered.
Perhaps more light will b shed on the improvement in DCF cited by management (up $26 million in 1Q13 vs. 1Q12 and up $128 million in the TTM ended 3/31/13 vs. the prior year period) when EPB provides additional information as part of its 10-Q filing. In the meantime, note that the DCF numbers for the TTM ended 3/31/13 reflect numerous adjustments that appear to be related to the CIG and CPG acquisitions.
EBP is unlikely to be able to continue growing distributions at the recently experienced rates. For example, DCF per unit grew 21% on a TTM basis, but at a slower pace of 13% from 1Q12 to 1Q13. From 4Q12 to 1Q13 DCF per unit growth slowed further, to just 3.7% (from $163 million to $169 million).
EPB increased its quarterly distribution by 22% from 1Q12 to 1Q13 and by 20% in the TTM period ending 3/31/13. Management projects distributions in 2013 will total $2.55 per unit, up 13% from the $2.25 per unit in 2012, and that EPB will end the year with excess coverage of $25 million. EPB’s budget includes the expected purchase (dropdown) of 50% of Gulf LNG from Kinder Morgan, Inc. (KMI) during the second half of 2013. Analysts have estimated a $750 million purchase price for this asset. The long-term debt to EBITDA as of 3/31/13 was 3.7x, so the balance sheet can absorb additional debt to fund the acquisition; but I expect EPB will issue additional equity to pay for a portion of that dropdown.
Disclosure: I continue to hold EPB.

The lack of revenue growth is troubling. In fact, revenues contracted despite full period contributions by Colorado Interstate Gas Company, L.L.C. (“CIG”) and Cheyenne Plains Investment Company, L.L.C., which owns Cheyenne Plains Gas Pipeline Company, L.L.C. (“CPG”). On May 24, 2012, EBD acquired the remaining 14% interest in CIG and 100% of CPG; thus, results for 1Q12 exclude contributions from CIG and CPG operations and results for the TTM ending 3/31/12 exclude ~2 months of contributions from CIG and CPG.
Net income improved on reduced operations and maintenance costs. Maintenance capital expenditures continue to be much lower than they were when EPB was part of El Paso Corp. Hopefully the lower levels reflect careful pruning of maintenance expenditures and corners are not being cut.
Management assesses segment performance based on “EBDA”, a metric defined as earnings before depreciation and amortization, certain general and administrative (“G&A”) expenses and interest expense. These certain G&A expenses include employee benefits, legal, information technology and other costs that are not deemed controllable by operating management and thus are not included in the measure of performance for which each segment is accountable. Many master limited partnerships {“MLPs”) use their own unique performance measure (EPB is no different in that sense) which makes comparison across MLPs difficult.
While EBDA improved by 12% in 1Q13 and by 9% in the TTM ending 3/31/13 compared to the prior year periods, this is in large part due to the full period contributions by CIG and CPG noted above.
My analysis of sustainable DCF will be completed after EPB provides additional cash flow information as part of its 10-Q filing expected shortly. Table 2 below adds TTM numbers to EPB’s April 18 press release which provides a reconciliation of net income to reported DCF for 1Q13 and 1Q12:

Table 2 reflects the fact that, having become a Kinder Morgan company, EPB now follows the method used by Kinder Morgan Energy Partners LP (KMP) to determine DCF. This method is detailed in an article titled Distributable Cash Flow (“DCF”) which also provides a comparison to definitions used by other MLPs. I find KMP’s method (now also EPB’s method) of deriving DCF (what these partnerships refer to as “DCF before certain items”) complex. It also differs considerably from the method used by other MLPs I have covered.
Perhaps more light will b shed on the improvement in DCF cited by management (up $26 million in 1Q13 vs. 1Q12 and up $128 million in the TTM ended 3/31/13 vs. the prior year period) when EPB provides additional information as part of its 10-Q filing. In the meantime, note that the DCF numbers for the TTM ended 3/31/13 reflect numerous adjustments that appear to be related to the CIG and CPG acquisitions.
EBP is unlikely to be able to continue growing distributions at the recently experienced rates. For example, DCF per unit grew 21% on a TTM basis, but at a slower pace of 13% from 1Q12 to 1Q13. From 4Q12 to 1Q13 DCF per unit growth slowed further, to just 3.7% (from $163 million to $169 million).
EPB increased its quarterly distribution by 22% from 1Q12 to 1Q13 and by 20% in the TTM period ending 3/31/13. Management projects distributions in 2013 will total $2.55 per unit, up 13% from the $2.25 per unit in 2012, and that EPB will end the year with excess coverage of $25 million. EPB’s budget includes the expected purchase (dropdown) of 50% of Gulf LNG from Kinder Morgan, Inc. (KMI) during the second half of 2013. Analysts have estimated a $750 million purchase price for this asset. The long-term debt to EBITDA as of 3/31/13 was 3.7x, so the balance sheet can absorb additional debt to fund the acquisition; but I expect EPB will issue additional equity to pay for a portion of that dropdown.
Disclosure: I continue to hold EPB.
