On February 27, 2013, Plains All American Pipeline L.P. (PAA) provided its 2012 annual report on Form 10-K. Results compared favorably to the prior year and to management’s guidance. Revenues, operating income, net income and earnings before interest, depreciation & amortization and income tax expenses (EBITDA) are summarized in Table 1:
On 11/5/12, the mid-point of the Adjusted EBITDA guidance for 2012 was $2,017 million, a ~7% increase vs. the guidance provided on 8/6/12 and ~22% over the full year guidance provided at the beginning of the year. On that date the preliminary Adjusted EBITDA guidance for 2013 was $1,925 million (mid-point). On 2/6/13 PAA increased its 2013 guidance to $1,976 million, but still a number lower than what was achieved in 2012. This is because management is operating on the assumption that 2012 was a year in which market conditions were extremely favorable for the Supply and Logistics segment, and that 2013 will see a "a return to baseline" after 1Q13.
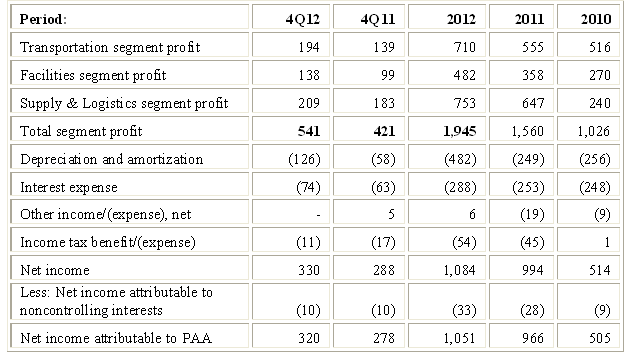
Strong performance was exhibited by all segments, as seen in Table 2:
In 3Q12 PAA decided not to proceed with the Pier 400 project and wrote down a substantial portion of its investment in it. The write down amounted to ~$125 million and is reflected in Table 2 as an increase to depreciation & amortization. Hence the large increase in this line item in 2012 vs. the prior year periods. The Pier 400 terminal project involved development of a deepwater petroleum import terminal at Pier 400 and Terminal Island in the Port of Los Angeles for the purpose of handling marine receipts of crude oil and refinery feedstock.
Unlike the Facilities and Transportation segments which are predominantly fee based businesses, Supply & Logistics is margin based and hence its results are more volatile. This segment has benefited from higher volumes and higher margins. Increased drilling activities and increased production of oil and natural gas liquids (“NGL”) in the areas it services (Bakken, Eagle Ford, West Texas, Western Oklahoma and Texas Panhandle) drove higher volumes. Margins were driven higher because production volumes exceed existing pipeline takeaway capacity in these regions, so customers will pay more to whoever can get their products to markets. Supply-demand imbalances also increased the volatility of historical differentials for various grades of crude oil and also impacted the historical pricing relationship between NGL and crude oil. Market conditions in 2011 and 2012 were thus highly favorable to the Supply & Logistics segment.
Management is being appropriately cautious in assuming that these conditions may not be repeated in 2013.
In an article titled Distributable Cash Flow (“DCF”) I present the definition of DCF used by Plains All American Pipeline L.P. (PAA) and provide a comparison to definitions used by other master limited partnerships. Using PAA’s definition, DCF in 2012 was $1,550 million ($4.73 per unit), up from $1,149 million ($3.84 per unit) in 2011. As always, I first attempt to assess how these figures compare with what I call sustainable DCF for these periods and whether distributions were funded by additional debt or issuing additional units.
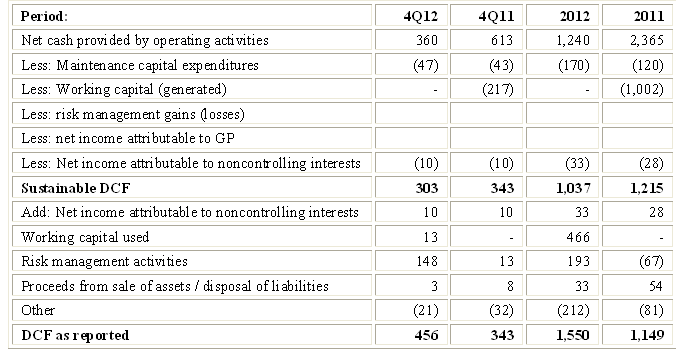
The generic reasons why DCF as reported by the MLP may differ from sustainable DCF are reviewed in an article titled Estimating Sustainable DCF-Why and How. Applying the method described there to PAA’s results through 12/31/12 generates the comparison outlined in Table 3 below: 
The principal differences between reported DCF and sustainable DCF relate working capital, risk management activities and a variety of items grouped under “Other”.
Under PAA’s definition, reported DCF always excludes working capital changes, whether positive or negative. My definition of sustainable DCF only excludes working capital generated (I deduct working capital consumed). Despite appearing to be inconsistent, this makes sense because in order to meet my definition of sustainability the MLP should generate enough capital to cover normal working capital needs. On the other hand, cash generated by the MLP through the liquidation or reduction of working capital is not a sustainable source and I therefore ignore it. Over reasonably lengthy measurement periods, working capital generated tends to be offset by needs to invest in working capital. A good example of this is provided by the working capital lines for 2011 and 2012 in Table 3. In 2012 working capital consumed cash principally due to an increase in crude oil inventories, while in 2011 crude oil inventories were liquidated and thus generated a very significant amount of cash. Overall, in 2012 working capital consumed cash amounting to $466 million. Management adds back this amount in deriving reported DCF while I do not.
The $193 million adjustment for risk management activities in 2012 consists primarily of foreign currency adjustments and losses from derivative activities. Management adds back these losses in calculating reported DCF. I do not do so when calculating sustainable DCF.
The $212 million adjustment for “Other” items in 2012 consists of non-cash compensation, losses on inventory valuation adjustments, and distributions in excess of earnings from unconsolidated investments. Again, management adds back these items in calculating reported DCF. I do not do so when calculating sustainable DCF.
PAA increased DCF guidance for 2012 to a mid-point of $1,437 million (up from $1,352 million guidance provided last November), but still lower than 2012 reported DCF for the same reasons outlined in the discussion of Table 1.
As seen in Table 3, the differences between reported and sustainable DCF can be pronounced. This, of course, impacts coverage ratios, as indicated in Table 4 below:
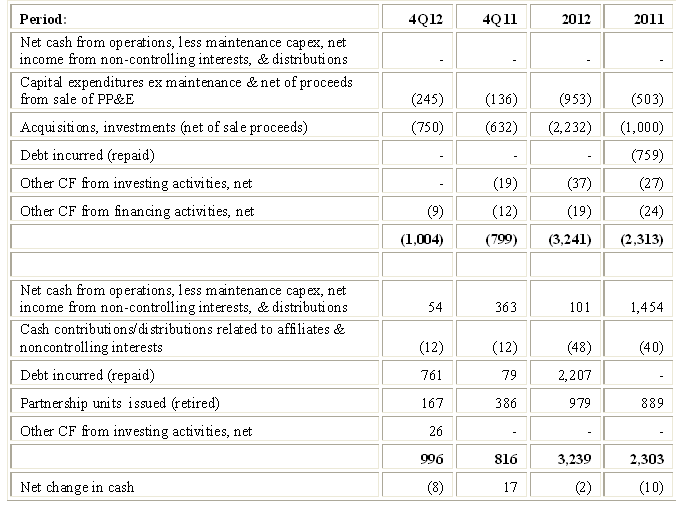
I find it helpful to look at a simplified cash flow statement by netting certain items (e.g., acquisitions against dispositions) and by separating cash generation from cash consumption. Here is what I see for PAA:
Simplified Sources and Uses of Funds
Net cash from operations, less maintenance capital expenditures, less cash related to net income attributable to non-controlling partners exceeded distributions by $101 million in 2012 and by $1,454 million in 2011. The large difference between the excess in these two years is due to changes in crude oil inventories (increase in 2012, decrease in 2011, as explained in the discussion of Table 3). Clearly PAA is not using cash raised from issuance of debt and equity to fund distributions.
Over the past 5 years (2008-2012) net cash from operations generated a cumulative excess of ~$962 million (after deducting maintenance capital expenditures, net income from non-controlling interests, and distributions). Such excesses constitute significant sources of capital for PAA and reduce reliance on debt or issuance of additional units that dilute existing holders. This is of particular importance to PAA limited partners because issuing new units is very expensive due to the general partner’s incentive distribution rights (“IDR”). The IDRs entitle the general partner to 48% of amounts distributed in excess of $0.3375 per unit. Therefore at the current distribution rate of $0.5625 per quarter, each additional unit issued consumes ~$0.88 of DCF per quarter. This is a heavy burden that pushes up PAA’s cost of capital. The excess cash flow has a very low cost of capital compared to the cost of issuing additional units.
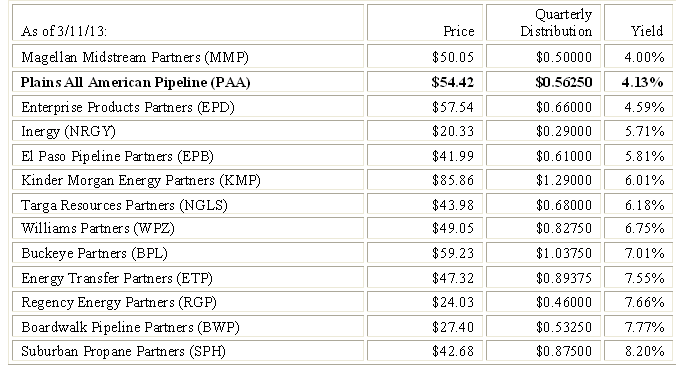
PAA’s current yield is at the low end of the MLP universe. A comparison to some of the MLPs I follow is provided in Table 6 below:
PAA, EPD and MMP are all outstanding MLPs. The relatively low yields notwithstanding, their operational results have been excellent and have driven up unit prices, thus generating significant capital gains for the partners. They are a solid choice for more conservative MLP investors. My concerns with PAA revolve around capital structure and the sharper run-up in its unit price. From a capital structure standpoint, EPD and MMP are not burdened by IDRs while PAA pays 48% at the margin. While the IDR burden is less of an issue with respect to organic growth (because of the low ratio of required investment to the expected cash flow it will generate), it is a major factor in large acquisitions which, under current market conditions, command high multiples and require lengthy time periods to generate the projected synergies. From a price per unit standpoint, year-to-date PAA’s unit price is up ~20% vs. 15% for EPD and ~16% for MMP.
- English (UK)
- English (India)
- English (Canada)
- English (Australia)
- English (South Africa)
- English (Philippines)
- English (Nigeria)
- Deutsch
- Español (España)
- Español (México)
- Français
- Italiano
- Nederlands
- Português (Portugal)
- Polski
- Português (Brasil)
- Русский
- Türkçe
- العربية
- Ελληνικά
- Svenska
- Suomi
- עברית
- 日本語
- 한국어
- 简体中文
- 繁體中文
- Bahasa Indonesia
- Bahasa Melayu
- ไทย
- Tiếng Việt
- हिंदी
Closer Look At Plains All American Pipeline’s Distributable Cash Flow
Published 03/13/2013, 06:35 AM
Updated 07/09/2023, 06:31 AM
Closer Look At Plains All American Pipeline’s Distributable Cash Flow
Latest comments
Install Our App
Risk Disclosure: Trading in financial instruments and/or cryptocurrencies involves high risks including the risk of losing some, or all, of your investment amount, and may not be suitable for all investors. Prices of cryptocurrencies are extremely volatile and may be affected by external factors such as financial, regulatory or political events. Trading on margin increases the financial risks.
Before deciding to trade in financial instrument or cryptocurrencies you should be fully informed of the risks and costs associated with trading the financial markets, carefully consider your investment objectives, level of experience, and risk appetite, and seek professional advice where needed.
Fusion Media would like to remind you that the data contained in this website is not necessarily real-time nor accurate. The data and prices on the website are not necessarily provided by any market or exchange, but may be provided by market makers, and so prices may not be accurate and may differ from the actual price at any given market, meaning prices are indicative and not appropriate for trading purposes. Fusion Media and any provider of the data contained in this website will not accept liability for any loss or damage as a result of your trading, or your reliance on the information contained within this website.
It is prohibited to use, store, reproduce, display, modify, transmit or distribute the data contained in this website without the explicit prior written permission of Fusion Media and/or the data provider. All intellectual property rights are reserved by the providers and/or the exchange providing the data contained in this website.
Fusion Media may be compensated by the advertisers that appear on the website, based on your interaction with the advertisements or advertisers.
© 2007-2024 - Fusion Media Limited. All Rights Reserved.
