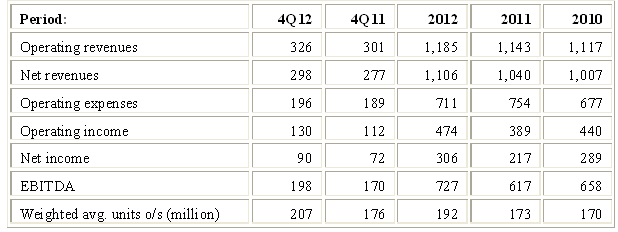
On February 20, 2013, On October 30, 2012, Boardwalk Pipeline Partners, LP (BWP) provided its 2012 annual report on Form 10-K. Revenues, operating income, net income and earnings before interest, depreciation & amortization and income tax expenses (“EBITDA”) for 4Q12, 2012 and prior periods are summarized in Table 1:
Historical amounts for the year ended December 31, 2011, have been recast to retroactively reflect the acquisition of Boardwalk HP Storage Company, LLC (“HP Storage”).
As a reminder, HP Storage was formed in 4Q11as a joint venture in which the BWP had a 20% stake and Boardwalk Pipelines Holding Corp. (“BPHC”, BWP’s general partner) had an 80% stake. In December 2011the joint venture paid $545.5 million to acquire seven salt dome natural gas storage caverns in Forrest County, Mississippi, with ~36.3 billion cubic feet (“Bcf”) of total storage capacity (of which ~ 23 Bcf is working gas capacity). HP Storage also operates approximately 105 miles of pipelines that connect its facilities with several major natural gas pipelines and also owns undeveloped land suitable for up to six additional storage caverns, one of which is expected to be placed in service in 2013.In February 2012, BWP acquired from its general partner, the remaining 80% equity interest in Boardwalk HP Storage Company, LLC (“HP Storage”) for ~$285 million.
The revised 2011 numbers in Table 1 are presented as if the HP Storage acquisition had occurred on 12/1/2011 (the acquisition date). But they are not significantly different from what was originally reported. Operating revenues were revised up by $4.1 million, operating income as revised down by $3.5 million and net income was revised up by $3 million.
In October 2012, BWP acquired PL Midstream, LLC (renamed “Louisiana Midstream”) from PL Logistics, LLC for ~$620 million in cash. Louisiana Midstream provides transportation and storage services for natural gas and natural gas liquids (“NGLs”), fractionation services for NGLs, and brine supply services for producers and consumers of petrochemicals through two hubs in southern Louisiana - the Choctaw Hub in the Mississippi River Corridor area and the Sulphur Hub in the Lake Charles area. Assets acquired include ~53.2 million barrels of salt dome storage capacity, significant brine supply infrastructure; and more than 240 miles of pipelines (including an extensive ethylene distribution system). This acquisition represents a major step for BWP in implementing its strategy to diversify from its core business (natural gas pipelines and storage) into the midstream energy businesses.
Net revenues (i.e., after deducting fuel and transportation expenses) increased by $66 million in 2012 vs. 2011. But the increase was almost entirely driven by $61million of net revenues contributed by HP Storage and Boardwalk Louisiana Midstream in 4Q12. The balance is due to an increase in parking & lending (“PAL”) and storage revenues (reflecting improved market conditions), offset by a decrease in retained fuel, primarily due to lower natural gas prices. Lower natural gas prices translate into lower revenues for fuel retained in kind as payment for transportation services. Net revenues increased by $21 million in 4Q12 vs. 4Q11. Likewise, the increase was entirely driven by $25 million of net revenues contributed by HP Storage and Boardwalk Louisiana Midstream in 4Q12.
Net income and EBITDA in 2012 were adversely affected by $15 million of operating expenses associated with the acquisition of HP Storage and Boardwalk Louisiana Midstream. Nevertheless, net income and EBITDA increased by ~$89 million and $110 million, respectively, in 2012 vs. 2011, primarily due to the acquisitions of Louisiana Midstream and HP Storage. Other major factors driving the 2012 increase in net income were ~$41 million of impairments and other special charges incurred in 2011.
On a pro forma basis, assuming the acquisitions had occurred on January 1, 2011, 2012 revenues would have been $1,241 million, down 1% vs. $1,254 in 2011, while net income would have been $327 million in 2012 vs. $254 million in 2011 (but, as noted above, much of that improvement in net income elates to special charges incurred in 2011 and not repeated in 2012).
Management warns that the amount of contracted transportation capacity which will expire in 2013 is greater than in recent years. In light of the market conditions discussed above, BWP expects that transportation contracts renewed or entered into in 2013 will be at lower rates than expiring contracts. Remaining available capacity will be marketed and sold on a short-term firm or interruptible basis, which will also be at lower rates, due to a decrease in basis spreads between locations on the pipelines.
See “Glossary of MLP Operational Terms” for a brief description of what are firm and interruptible transportation services, and of PAL. Management noted it expects that these circumstances will negatively affect transportation revenues, EBITDA and distributable cash flows in 2013. Annual revenues associated with contracts expiring in 2013 total ~$125 million and management estimates that the combination of lower rates on contract renewals and the remarketing of turn-back capacity will result in an annual revenue reduction of approximately $40 million.
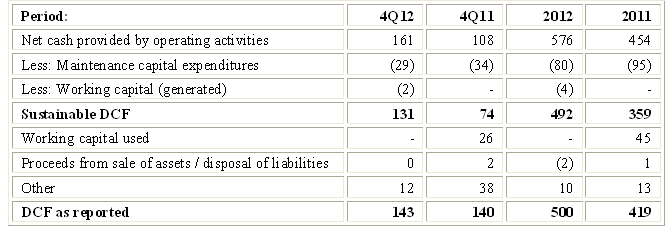
BWP’s definition of Distributable Cash Flow (“DCF”) and a comparison to definitions used by other master limited partnerships (“MLPs”) are described in a prior article. Using that definition, DCF for 2012 was $500 million ($2.60 per unit), up from $419 million in 2011 ($2.42 per unit).
As always, I first attempt to assess how these DCF figures compare with what I call sustainable DCF for these periods and whether distributions were funded by additional debt or issuing additional units. Given quarterly fluctuations in revenues, working capital needs and other items, it makes sense to review TTM numbers rather than quarterly numbers for the purpose of analyzing changes in reported and sustainable distributable cash flows.
The generic reasons why DCF as reported by the MLP may differ from sustainable DCF are reviewed in an article titled Estimating Sustainable DCF-Why and How. Applying the method described there to BWP results generates the comparison outlined in Table 2 below: 
Under BWP’s definition, reported DCF always excludes working capital changes, whether positive or negative. In contrast, as detailed in my prior articles, I generally do not include working capital generated in the definition of sustainable DCF but I do deduct working capital invested. Despite appearing to be inconsistent, this makes sense because in order to meet my definition of sustainability the master limited partnerships should, on the one hand, generate enough capital to cover normal working capital needs. On the other hand, cash generated from working capital is not a sustainable source and I therefore ignore it. Over reasonably lengthy measurement periods, working capital generated tends to be offset by needs to invest in working capital. I therefore do not add working capital consumed to net cash provided by operating activities in deriving sustainable DCF. Cash consumed by working capital accounts for $45 million of the $60 million variance between reported and sustainable DCF in 2011.
In 2012 and 2011, the principal components of items in Table 2 grouped under “Other” are non-cash interest expense and proceeds from an insurance settlement received associated with the fire at BWP’s Carthage compressor station and a legal settlement. I exclude them from the sustainable category.
Coverage ratios are indicated in Table 3 below:
Distributions are not really growing ($0.5150 per unit in 4Q10 vs. $0.5325 in 4Q12, a 3.4% increase in 2 years). Despite that, coverage ratios are thin. Making them more robust will be challenging given that over 32 million units have been issued in 3 separate equity offerings so far in 2012 and that the number of units outstanding now exceeds 218 million, up ~18% from ~185 million at the beginning of the year.
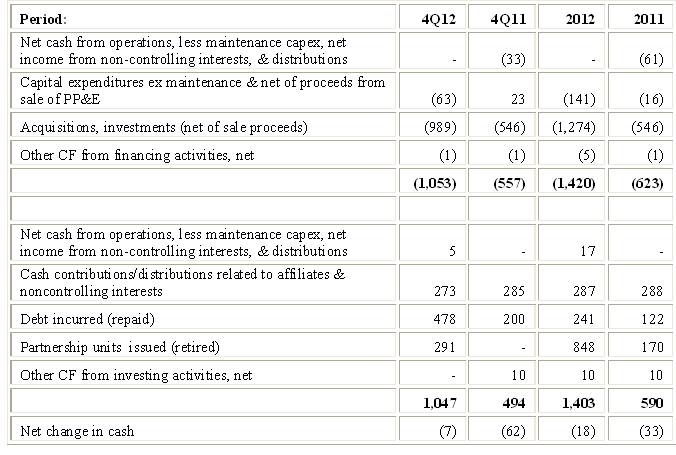
The simplified cash flow statement in Table 4 below nets certain items (e.g., debt incurred vs. repaid), separates cash generation from cash consumption, and gives a clear picture of how distributions have been funded in the last two years.
Simplified Sources and Uses of Funds 
Net cash from operations less maintenance capital expenditures did not cover distributions in 2011 and did so (just barely) in 2012. But Table 4 does indicate that in 2012, unlike 2011, distributions were not partially financed by issuing debt and/or equity.
Approximately $282 million of the $848 million of equity issuance in 2012 is an adjustment to partners’ capital. This is because the February 2012 drop down acquisition by BWP of the remaining 80% stake in HP Storage (previously held by BPHC) was accounted for as a transaction between entities under common control. Therefore, the assets and liabilities of HP Storage were recognized at their carrying amounts at the date of transfer and $281.8 million (the carrying amount of the net assets acquired) was treated as an adjustment to partners’ capital.
In February 2012, BWP issued 9.2 million units at $27.55 per unit, receiving net cash proceeds of ~$250.2 million. In an article dated 6/4/12, I said I would not be surprised to see additional partnership units being issued later this year. Indeed, in August BWP issued 11.6 million units at $27.80 per unit generating net proceeds of ~$318 million; and in October 2012 it issued 11.2 million units at $26.99 per unit generating net proceeds of ~$298 million. The most recent equity issuance was in connection with the Louisiana Midstream acquisition.
In 2012 BWP had projected spending $200 million on growth capital expenditures. The actual number was ~$150 million because $50 million was pushed into the first part of 2013. Consequently, the 2013 budget for growth capital expenditures was increased by that amount and is now estimated at ~$250 million. BWP’s major expansion projects are summarized below:
Southeast Market Expansion: this ~$300 million project involves constructing an interconnection between BWP’s Gulf South and HP Storage subsidiaries, adding additional compression facilities and constructing approximately 70 miles of 24” and 30” pipeline in southeastern Mississippi. The project is supported by 10-year firm agreements of primarily electric generation and industrial customers. BWP anticipates beginning construction in early 2014 and expected the project to be placed in service by 4Q14.
South Texas Eagle Ford Expansion: this ~ $180 project involves constructing a 55-mile gathering pipeline and a cryogenic processing plant in south Texas. The system will be capable of gathering in excess of 0.3 Bcf per day of liquids-rich gas in the Eagle Ford Shale production area, and of processing up to 150 million cubic feet (MMcf) per day of liquids-rich gas. The project is supported by long-term fee-based gathering and processing agreements with two customers who have committed to ~50% of the plant's processing capacity. The plant and new pipeline are expected to be placed in service in April 2013.
Natural Gas Salt-Dome Storage Project: BWP is expanding HP Storage’s salt cavern working gas capacity by ~5.3 Bcf. Injections are scheduled to begin in 2Q13 and the incremental capacity has been fully contracted for the first year that this cavern will be in service.
Choctaw Brine Supply Expansion Projects: these projects will expand Louisiana Midstream’s brine supply capabilities. The first project, developing a one million barrel brine pond, was placed into service January 2013. The second project consists of constructing 26 miles of 12-inch pipeline from BWP’s facilities to a petrochemical customer's plant. This project is supported by a 20-year contract with minimum volume requirements and expansion options and is expected to be completed in 2013.
In addition the projects listed above, BWP and Williams Companies, Inc. (WMB) executed a letter of intent on 3/6/13 to form a joint venture that would develop a pipeline project (the “Bluegrass Pipeline”) to transport natural gas liquids from the Marcellus and Utica shale plays to the petrochemical and export complex on the U.S. Gulf Coast, as well as the developing petrochemical market in the Northeast U.S. This project will require FERC approval and, assuming that and other hurdles will be overcome, is expected to be placed in service in 2015.
BWP is required to maintain a ratio of consolidated debt to EBITDA of no more than 5:1. BWP’s total long-term debt stood at $3.5 billion as of 12/31/12, a multiple of 4.87x EBITDA for the trailing 12-months on that date. This is an improvement over the ratio in 2011 which was in excess of 5x EBITDA.
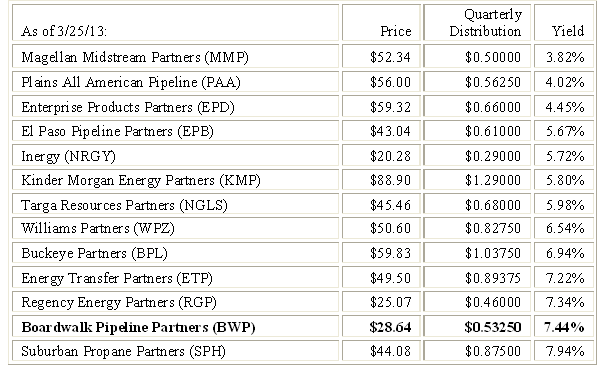
BWP’s current yield compares favorably with many the other MLPs I follow, as seen in Table 5 below: 
There has been minimal distribution growth over the past two years. Given uncertainty regarding customer contract renewals and its assessment of current market conditions, management decided it would not be prudent to increase distributions. I believe this is a sound decision. But I remain concerned about the thin coverage ratio and relatively high leverage. Despite the enticing yield, I still conclude that investors willing to add to their positions should consider other MLPs.
- English (UK)
- English (India)
- English (Canada)
- English (Australia)
- English (South Africa)
- English (Philippines)
- English (Nigeria)
- Deutsch
- Español (España)
- Español (México)
- Français
- Italiano
- Nederlands
- Português (Portugal)
- Polski
- Português (Brasil)
- Русский
- Türkçe
- العربية
- Ελληνικά
- Svenska
- Suomi
- עברית
- 日本語
- 한국어
- 简体中文
- 繁體中文
- Bahasa Indonesia
- Bahasa Melayu
- ไทย
- Tiếng Việt
- हिंदी
Closer Look At Boardwalk Pipeline Partners’ Distributable Cash Flow
Published 03/27/2013, 08:18 AM
Updated 07/09/2023, 06:31 AM
Closer Look At Boardwalk Pipeline Partners’ Distributable Cash Flow
3rd party Ad. Not an offer or recommendation by Investing.com. See disclosure here or
remove ads
.
Latest comments
Install Our App
Risk Disclosure: Trading in financial instruments and/or cryptocurrencies involves high risks including the risk of losing some, or all, of your investment amount, and may not be suitable for all investors. Prices of cryptocurrencies are extremely volatile and may be affected by external factors such as financial, regulatory or political events. Trading on margin increases the financial risks.
Before deciding to trade in financial instrument or cryptocurrencies you should be fully informed of the risks and costs associated with trading the financial markets, carefully consider your investment objectives, level of experience, and risk appetite, and seek professional advice where needed.
Fusion Media would like to remind you that the data contained in this website is not necessarily real-time nor accurate. The data and prices on the website are not necessarily provided by any market or exchange, but may be provided by market makers, and so prices may not be accurate and may differ from the actual price at any given market, meaning prices are indicative and not appropriate for trading purposes. Fusion Media and any provider of the data contained in this website will not accept liability for any loss or damage as a result of your trading, or your reliance on the information contained within this website.
It is prohibited to use, store, reproduce, display, modify, transmit or distribute the data contained in this website without the explicit prior written permission of Fusion Media and/or the data provider. All intellectual property rights are reserved by the providers and/or the exchange providing the data contained in this website.
Fusion Media may be compensated by the advertisers that appear on the website, based on your interaction with the advertisements or advertisers.
© 2007-2024 - Fusion Media Limited. All Rights Reserved.
