As discussed last week in “Bulls Chant,” the markets pushed toward all-time highs:
“While weaker economic data has not yet dented the “bullish sentiment” at this juncture, it doesn’t mean it won’t. However, as we have discussed over the last several weeks, a breakout of the consolidation range, which was capped by the June highs, would put all-time highs into focus.”
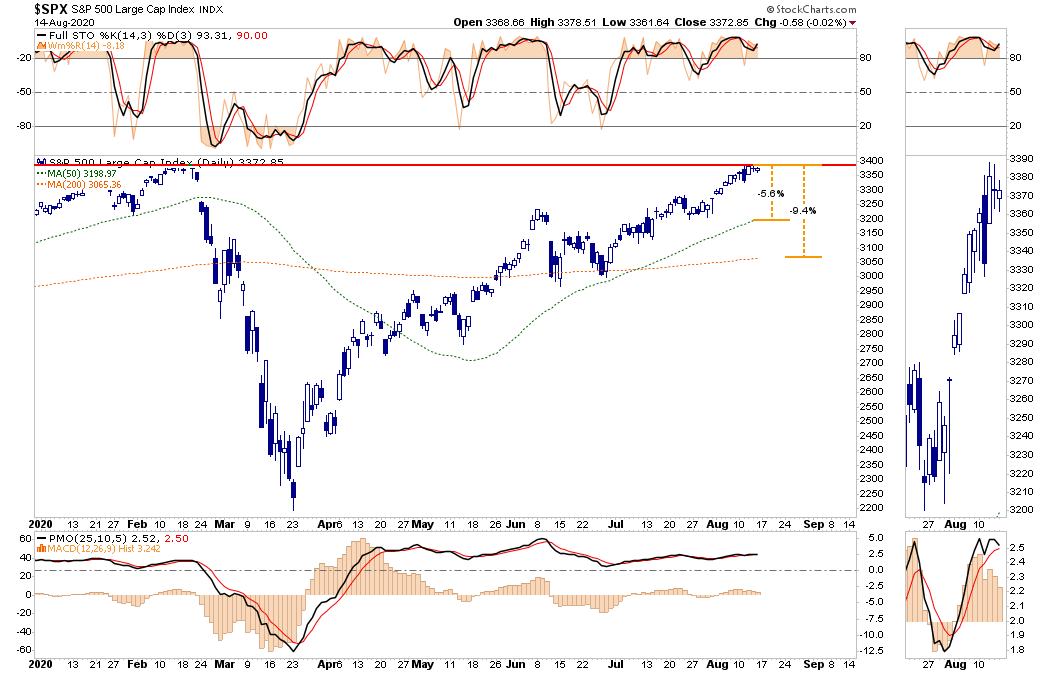
This week, despite repeated attempts, the bulls were unable to close above all-time highs solidly. As they say, “it was close, but no cigar.”
With options expiring next week, the bulls are going to attempt to push markets up. A breakout to all-time highs is entirely possible. However, the question is whether they will be able to maintain it?
A Normal Correction Is Likely
With the markets overbought on several measures, there is a downside risk heading into the end of the month. These risks come from several fronts we will discuss momentarily. However, from a technical perspective, the downside risk is about 5.6% to the 50-dma and 9.4% to the 200-dma. (Shown above)
A 5-10% decline in any given year is not outside of the norm. However, since investors have entirely forgotten what a drop feels like, a 5-10% slide will “feel” worse than it is.
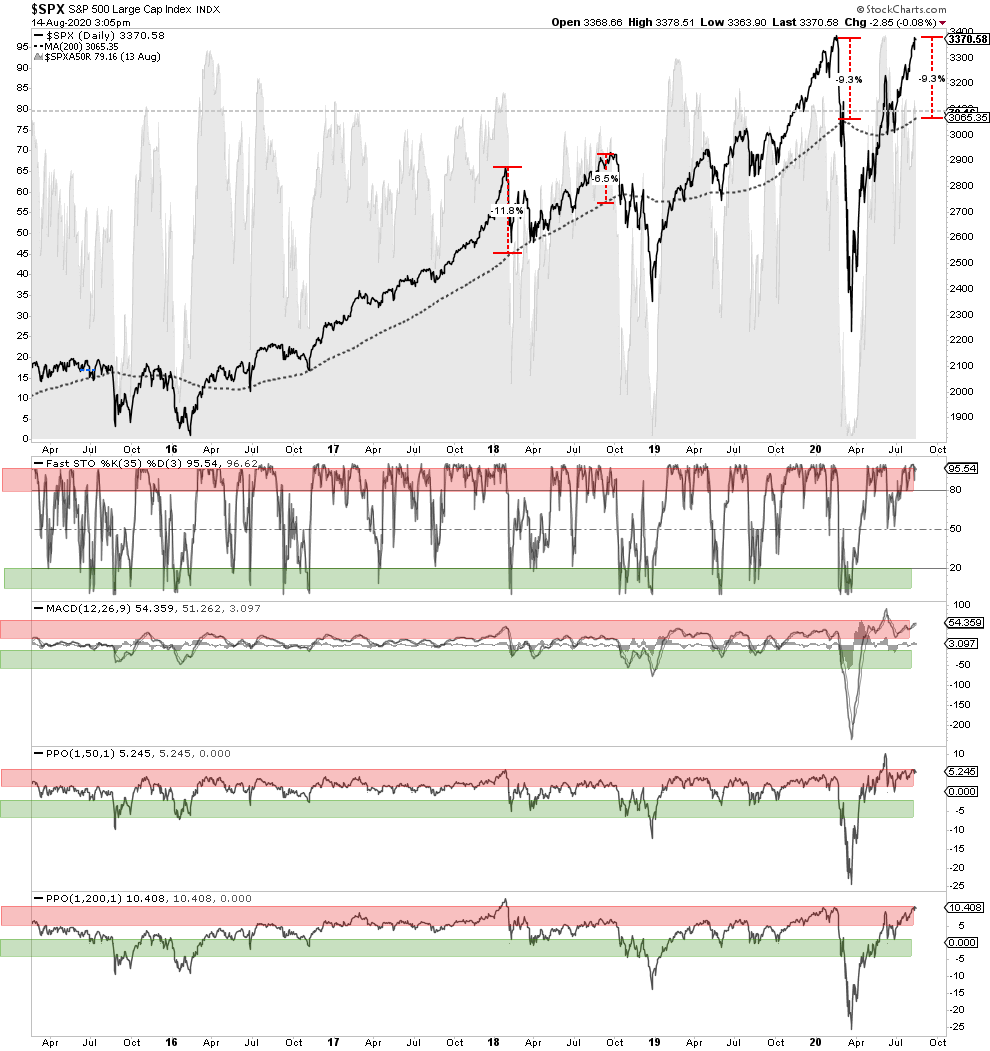
As I stated, the market is overbought on multiple measures, which have typically coincided with short-term market peaks and corrections. With the S&P now trading more than 9% above the 200-dma, and all indicators back to overbought conditions, it is worth wary of potential short-term correction risks.
Another way to look at deviations is where the S&P 500 ETF (NYSE:SPY) trades relative to its 250-day volume-weighted average price (VWAP.) While deviations have been more extreme in the past, this is currently the highest level since February.
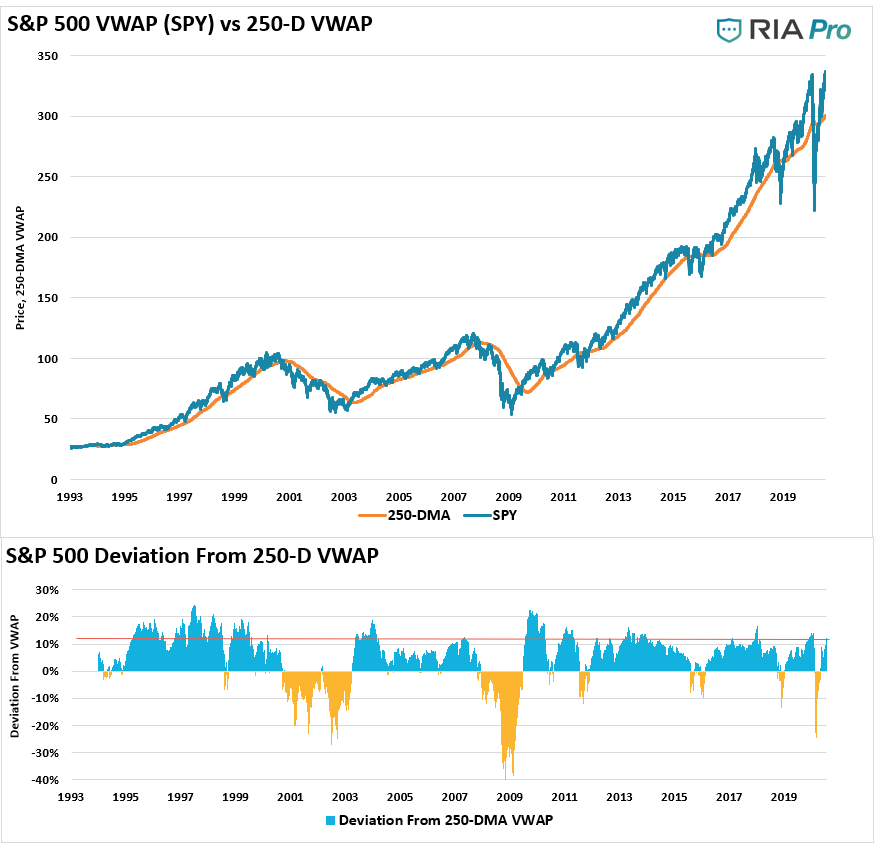
All this indicator suggests it there is “fuel” for a correction in the markets short-term. What is needed, of course, is a “catalyst” to ignite sellers.
That is where our discussion of the “Income Cliff” comes in.
The Income Cliff
One of the significant risks facing the market over the next couple of months is the “income cliff” as extended unemployment benefits run dry.
“Last month, we argued that rapid and robust fiscal stimulus was a critical driver of the initial V-shaped recovery in consumer spending. Therefore, several benefits cliffs could endanger this momentum as the removal of government support was premature.
The evaporation of these benefits highlights near-term downside risks to consumer spending, particularly for lower-income households, which have been a critical engine of the recovery despite being disproportionately more likely to lose a job during the pandemic — a testament to the effectiveness of the income supplement.” – Matt Luzzetti, chief U.S. economist at Deutsche Bank.
While the White House announced last week it would take executive action to reallocate unused dollars from the CARES Act to supplement existing unemployment programs, there remain challenges. At this point, there are no additional $1200 checks going to households, and as shown below, other benefits are plunging.
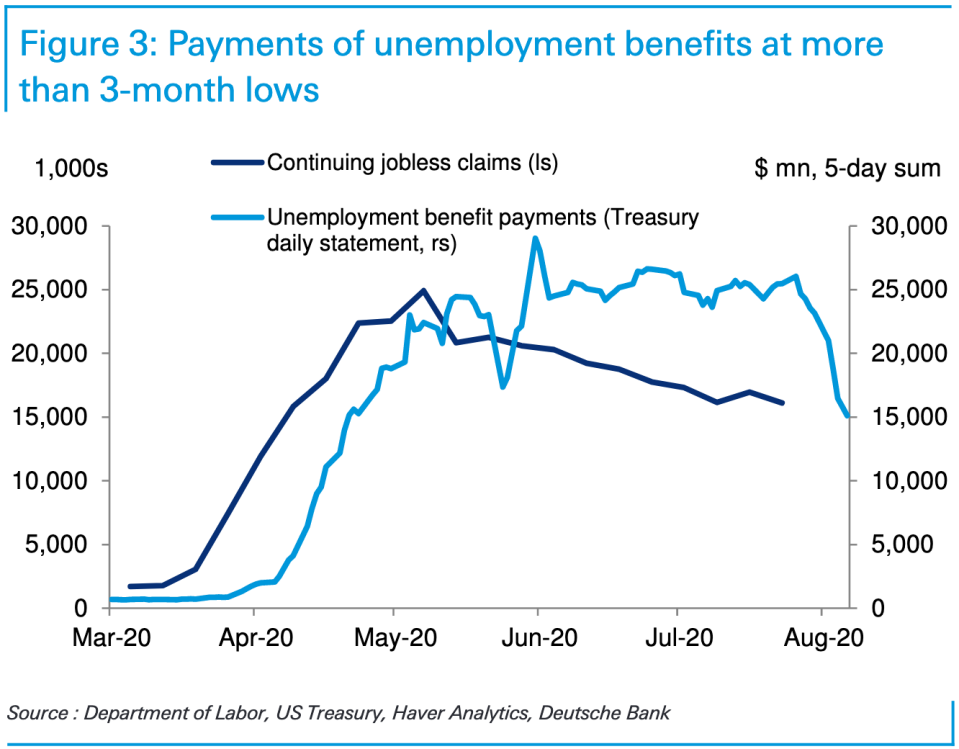
The initial rebound in retail sales, and much of the economic data, came from $1200 checks and $600/week in additional benefits. With Congress now heading off to summer recess, and the pre-election rhetoric about to begin, there is a risk of delay in any additional relief. Importantly, even if the passage of additional relief occurs, it will be less than previous amounts, which will slow any economic recovery.
Since sales are what drives corporate earnings, you can see the stock market’s issue over the next few quarters.
While watching the “income cliff” carefully, my colleague Doug Kass lays out 10-other risks, which could also provide the catalyst for a correction.
10-Other Factors That Could Spark A Correction
“My view is that the period leading up to the November election holds a list of unique and potentially worrisome risks:
- Fundamentals Remain Too Optimistic.
- Technical Deterioration. Market breadth and new highs (only 59 yesterday), investor sentiment is growing ebullient (put/call ratios at a multi-month lows), the National Association of Active Investment Managers (NAAIM) has its highest long exposure in years at 102.4.
- Covid-19 Remains A Wildcard. Currently, the virus continues to spread, and fatalities are expanding. Travel restrictions are tightening, schools and universities closing or have a reduced schedule, and small business openings remain uncertain. The recent fragile rise in consumer and business confidence could be fleeting.
- Speculation Is Beginning to Moderate. Losses in the “shiny objects” may now be accumulating.
- The China/U.S. Rift Is Widening. China will likely play hardball in the face of a potential change of the Presidency.
- For a Host of Reasons, Our Society is Fractured. An intensification of violence could shake confidence as social issues become more heated, leading into the November election.
- The Social Safety Net Is Beginning to Fade. Federal unemployment benefits are getting extended but only a fraction of the $600. PPP is expiring in early August and is not being replaced or at a fraction of the previous level.
- Market Structure Remains a Significant Risk. The intoxicating advance since March could easily move into reverse. “buyers live higher, but sellers live lower.”
- A Democratic Sweep Will Result in More Distributional Policies.
- Higher individual and corporate tax rates, a possible wealth tax, and potential threats to the tech market leaders’ monopolistic positions could undermine growth.
- There Are Numerous Knock On Problems That Could Reverberate in Our Economic and Markets Systems. Let’s call this the “unknowable”.
Sitting Closer To The Exit
Point 10 in Doug’s list is the most critical.
What eventually sparks a reversion is always the one thing no one is anticipating. Throughout history, the unexpected, exogenous event is what sends investors fleeing for the exits. After the damage occurs, the media’s excuse is always: “Well, no one could have seen that coming.”
As noted above, overbought, extended, overly bullish markets are by themselves “bullish.” These conditions represent the current “momentum,” which keeps pushing assets higher and dragging investors into the market.
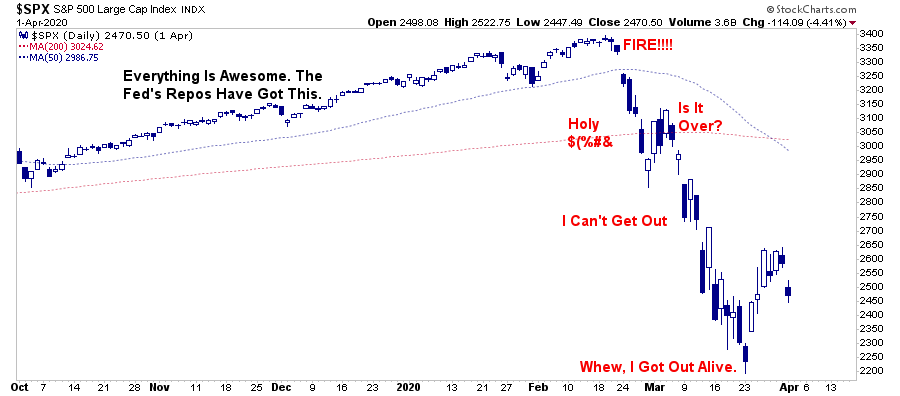
It’s very much like a crowded theater. Everything is fine, until that point where someone yells “fire.” At that point, everyone tries to rush towards a very narrow exit. The same holds for the market.
Such was a point we discussed in 2017 in the “Rise Of The Robots:”
“At some point, that reversion process will take hold. It is then investor ‘psychology’ will collide with ‘margin debt’ and ETF liquidity.
When the ‘robot trading algorithms’ begin to reverse, it will not be a slow and methodical process but rather a stampede with little regard to price, valuation n or fundamental measures. The exit will become very narrow.
Importantly, as prices decline, it will trigger margin calls, which will induce more indiscriminate selling. The forced redemption cycle will cause catastrophic spreads between the current bid and ask pricing for ETF’s. Such forces investors to dump positions to meet margin calls, the lack of buyers will form a vacuum causing rapid price declines. Such leaves investors helpless on the sidelines watching capital appreciation vanish in moments.”
No one believed me then. But it is what happened in March of 2020.
Hedging Risk
For all of these reasons, this is why we are sitting closer to exit.
Retail investors have packed themselves into the same theater under the belief that asset prices can only go higher. As noted, numerous things could spark a “fire.”
Furthermore, over the last couple of weeks, our portfolios remain weighted towards equity risk. Such makes us very uncomfortable, as “risk” controls are the backbone of our process.
Such remains the case this week.
Given we are now getting more extreme short-term overbought conditions, the risk of a short-term reversion has risen. Therefore, we continued making changes to portfolios last week.
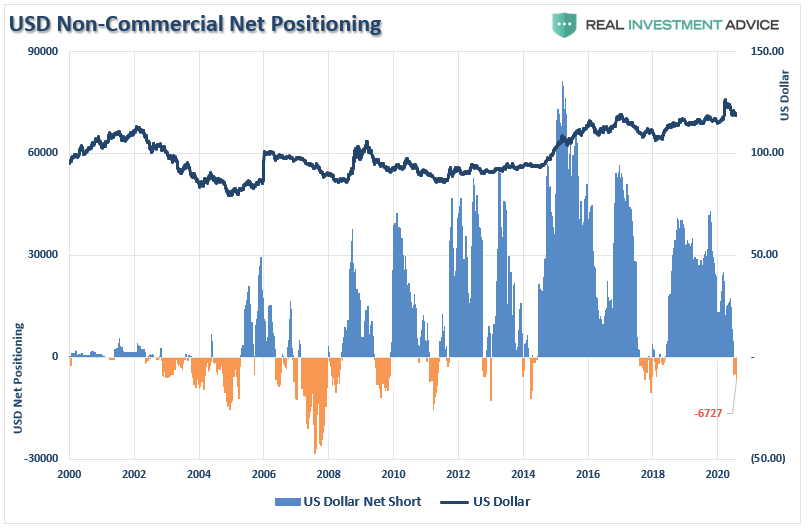
As noted previously in our “Commitment of Traders” report, the rather large short position in the US dollar is a sign to hedge our dollar-based exposures (stocks, gold, and energy.) Therefore, we have been building a long-dollar position over the last two weeks and added to it again on Friday.
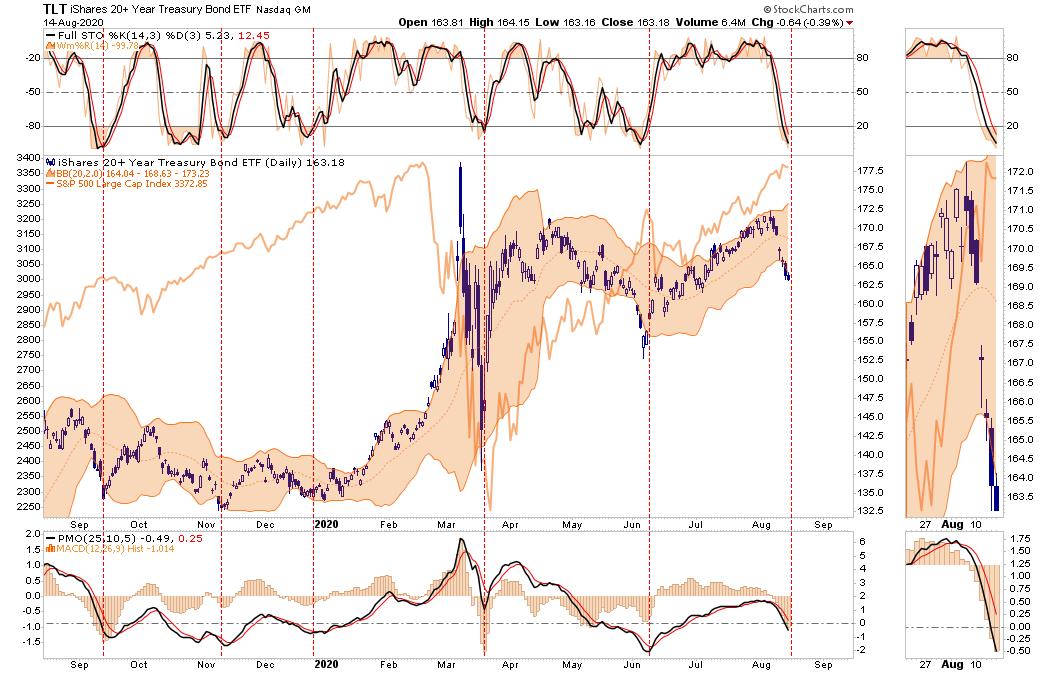
Furthermore, we added to our bond holdings (via TLT), given the more extreme oversold condition. Just in case there is a correction, bonds should act as a hedge.
We are also beginning to add additional “value” positions to the portfolio. These positions carry high yields, have “fundamental value,” and have less downside currently. When the market begins to rotate towards safety, “value” may be a benefactor.
Consequently, the time has come to be more conservative in portfolios, even at the expense of short-term performance. When there is a more evident opportunity to take on risk, we will undoubtedly do so aggressively.
Sometimes, when you don’t know what to do, the best thing to do is not play.
