Neely’s B-Failure Flat Set-Up
A Crash Followed by a Partial Retrace Followed by a Return to the Crash Low is a Set-Up for a Return to the All-Time High
Glenn Neely’s book, Mastering Elliot Wave (Version 2), provides a useful collection of trading set-ups and data. One particular set-up in Neely’s book that has paid off time and again in recent years is a formation he calls a B-Failure Flat.
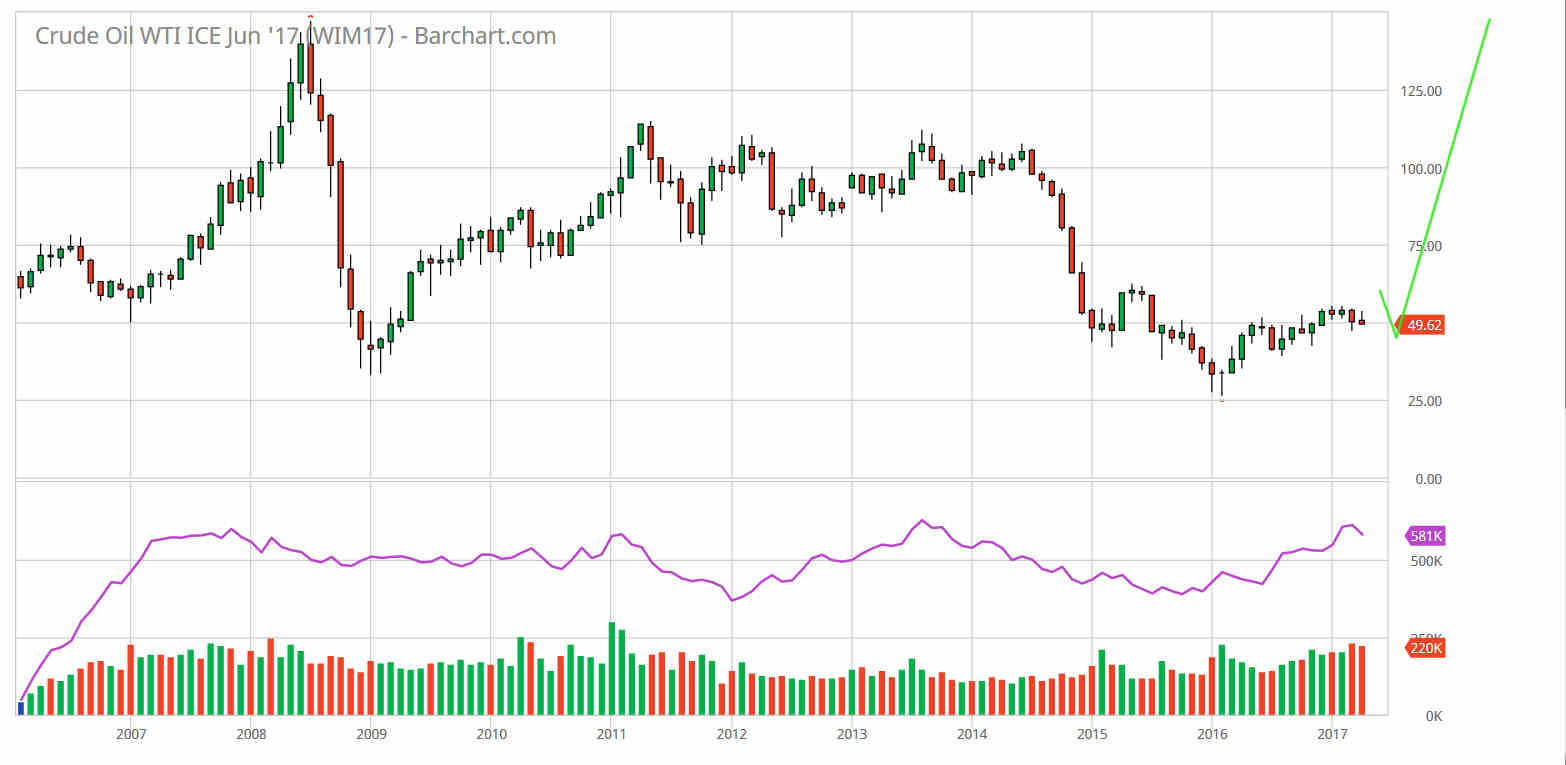
You tend to see these formations after crash waves like PowerShares QQQ Trust Series 1 (NASDAQ:QQQ)'s crash out of the dot-com bubble and the big 2008 plunge in oil. If the crash wave takes a particular form, the reaction wave (or “B wave”) that follows tends to retrace roughly 60% of the crash. It doesn’t have to be 60%. It just has to be a significant retrace that doesn’t make it back to the high.
The B wave reaction tops with range trading, typically forming a head and shoulders or megaphone top or an extended triangle, then the price collapses (in a “C wave”) back to the crash wave low.
Calumet Specialty Products Partners (NASDAQ:CLMT) is about to complete this pattern. After it completes a bottom, its next target is the all-time high.
Here’s the set-up on QQQ:

Neely B-Failure Flat Set-Up on QQQ
Here’s the set-up on oil:

Same Set-Up on Oil
It’s a set-up about a price that is taking huge swings around a correct price roughly in the middle.
A Great Short-Term Entry is Setting Up for CLMT’s Big Move Up

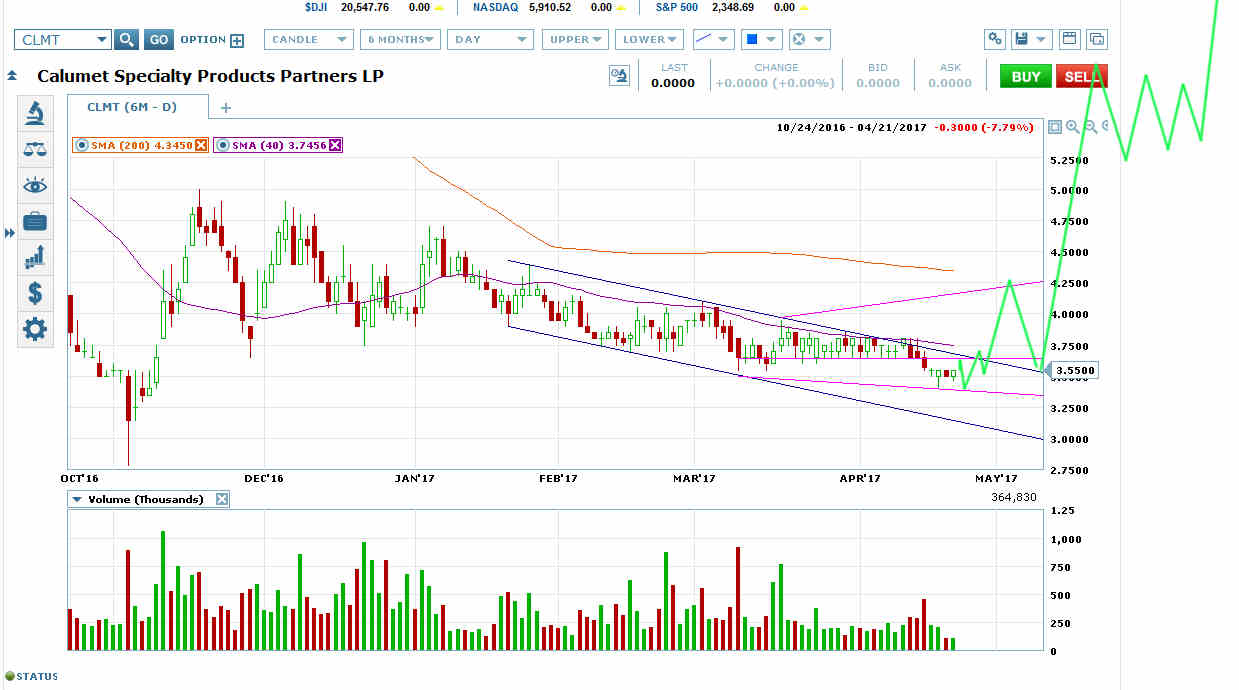
CLMT Opted to Start a Bottoming Pattern in the Critical Decision Wave of its Navy Price Channel
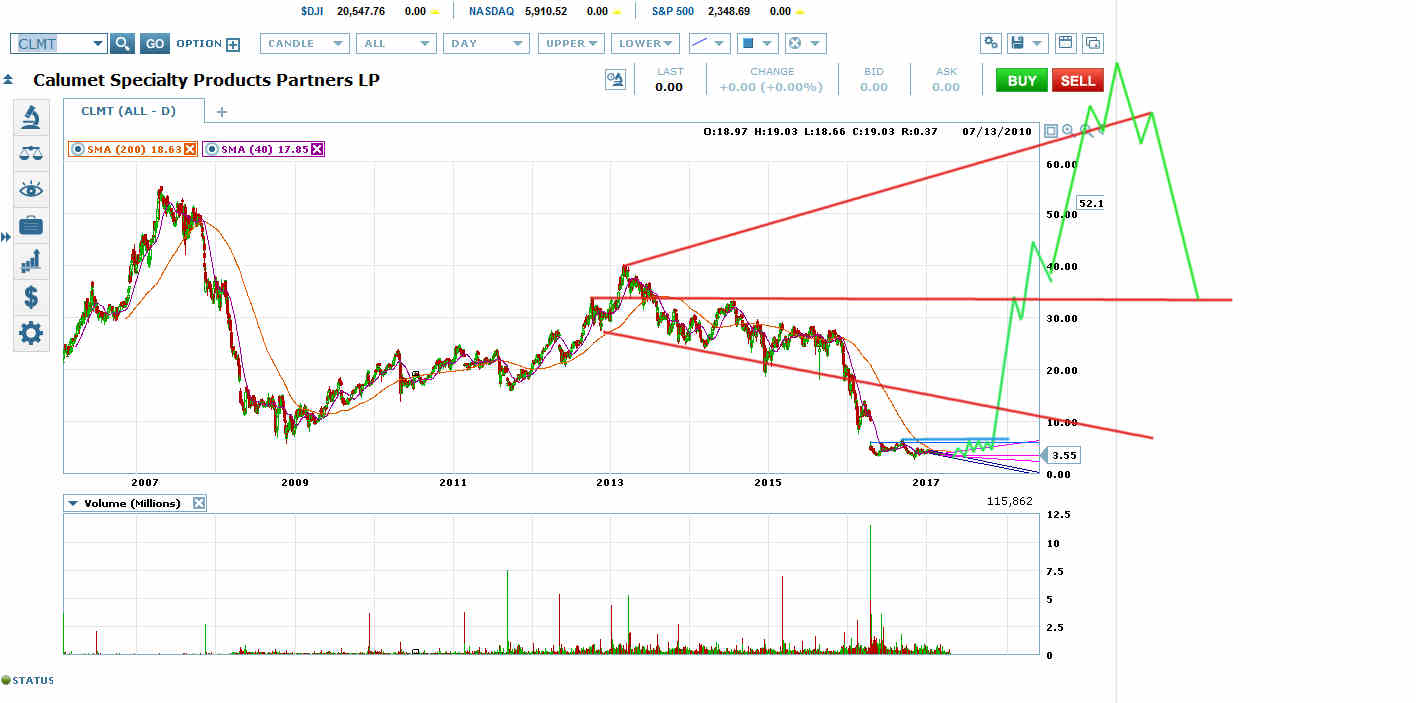
CLMT appears to be putting in an island bottom with a neckline at roughly 6 (see top chart). Obviously a gap up from an island bottom would be a great set-up to get long.
But for more nimble traders, a beautiful price channel bottoming set-up can get you in closer to the bottom.
Specifically, on the move down out of the early 2017 high, CLMT confirmed a price channel (navy blue in chart above). And in the channel’s critical decision wave (meaning the new channel low after two alternating touches on both the top and bottom), CLMT took a swing back up to the channel top rather than breaking out the bottom.
That channel provided a beautiful melt-down set-up to zero if CLMT was heading into bankruptcy. Instead CLMT started a megaphone bottom (pink in chart). A breakout now through the channel top would target roughly the pink megaphone top at the 200 dma. A final retest of the 40 dma would be the retrace to the pink megaphone VWAP that would set up a breakout up to the island bottom neckline at 6.
Typically there would be a bit of a consolidation there before the gap up into the big move up.
CLMT would typically bog down at roughly the 30 level on its big move up–usually to attempt a topping pattern like a head and shoulders at the red megaphone VWAP. The topping pattern would usually end up breaking out upwards to set up a big rising megaphone melt-up back to the all-time high.
We could also see a big Sornette melt-up set-up across 30 before blast-off.
Hat-tip to @jasteindorf1 for the stock. He has personal expertise in this company and product. The view of the stock provided, however, is strictly based on chart trading set-ups, not fundamentals. Do your own due diligence.
You could long on the price channel breakout and set your stop a little below the pink megaphone VWAP or 40 dma after breaking through.

