
Though fixed income trading income slumped as expected, Citigroup Inc. (NYSE:C) delivered a positive earnings surprise of 7.6% in fourth-quarter 2017 on prudent expense management and strong consumer banking. Adjusted earnings per share of $1.28 for the quarter easily outpaced the Zacks Consensus Estimate of $1.19. Also, earnings compared favorably with the year-ago figure of $1.14 per share.
Notably, results including non-recurring non-cash charge related to the tax reform of $22 billion, or $8.43 per share, reported loss of $18.3 billion or $7.15 per share.
Adjusted net income came in at $3.7 billion, up 4% year over year.
Overall top-line strength was reflected, driven by higher banking and consumer banking revenues, along with loan growth. Moreover, expenses dropped on efficiency savings by the bank.
However, Citigroup’s costs of credit for the fourth quarter were up 16% year over year to $2.1 billion. This rise largely reflects net credit losses of $1.9 billion and a net loan loss reserve build of $165 million.
For full-year 2017, adjusted net income came in at $15.8 billion compared with $14.9 billion recorded in 2016.
Top-Line Strength & Low Expenses Recorded
For full-year 2017, the company reported revenues of $71.4 billion, up 2% year over year. Furthermore, it surpassed the Zacks Consensus Estimate of $71.2 billion.
Revenues inched up 1% year over year to $17.3 billion in the reported quarter. The rise highlights elevated revenues in the global consumer banking, mostly offset by decline in institutional clients group and corporate/other revenues. The revenue figure also surpassed the Zacks Consensus Estimate of $17.1 billion.
At Institutional Clients Group (ICG), revenues came in at $8.1 billion in the quarter, down 1% year over year. Though securities services revenues increased 14%, lower equity markets (down 23%) and fixed income revenues (down 18%) offset the rise on a year-over-year basis. Notably, revenues from total banking climbed 11%.
Global Consumer Banking (GCB) revenues increased 6% year over year to $8.4 billion, mainly driven by higher revenues in North America, Latin America and Asia GCB.
Corporate/Other revenues were $746 million, decreasing 13% from the prior-year quarter. The decline mainly underlined legacy assets runoff.
Operating expenses at Citigroup were down slightly year over year to $10.1 billion. Efficiency savings and the winding-down of legacy assets mitigated increased volume-related expenses and ongoing investments.
Strong Balance Sheet
At quarter end, Citigroup’s end of period assets was $1.84 trillion, up 3% year over year. The company’s loans grew 7% year over year to $667 billion. Deposits increased 3% year over year to $960 billion.
Credit Quality Improved
Total non-accrual assets decreased 17% year over year to $4.8 billion. The company reported a drop of 15% in consumer non-accrual loans to $2.7 billion. In addition, corporate non-accrual loans of $1.9 billion went down 20% from the year-earlier period.
Citigroup’s total allowance for loan losses was $12.4 billion at quarter end, or 1.87% of total loans, compared with $12.1 billion, or 1.94%, recorded in the year-ago period.
Solid Capital Position
At the end of the reported quarter, Citigroup’s Common Equity Tier 1 Capital ratio was 12.3%, decreasing from 12.6% in the year-ago quarter. The company’s supplementary leverage ratio for the quarter was 6.7%, down from 7.2% in the year-earlier quarter.
As of Dec 31, 2017, book value per share was $70.85, down 5% year over year and tangible book value per share was $60.40, down 6% from the prior-year period. Results include mainly the estimated impact of the Tax Reform.
Capital Deployment
During fourth-quarter 2017, Citigroup repurchased about 74 million of common stock. Notably, the company returned around $6.3 billion to common shareholders as common stock repurchases and dividends.
Our Viewpoint
Citigroup reported impressive results this time around also, though the bank was impacted by non-recurring non-cash charges related to the tax reform. Furthermore, restructuring efforts, including streamlining moves, will likely continue to ease the bank’s burden on the expense base. The company exhibits capital strength which continues to support its dividend and a share buyback program. Also, rise in revenues is commendable.
One can consider a strong brand like Citigroup to be a sound investment option over the long term, given its global footprint and attractive core business. Additionally, the company’s growth looks encouraging amid the rising rate environment, as well as anticipated potential ease of regulations under President Trump’s administration.
Nevertheless, several legal hassles and escalating costs of credit remain concerns for the company.
Citigroup Inc. Price, Consensus and EPS Surprise
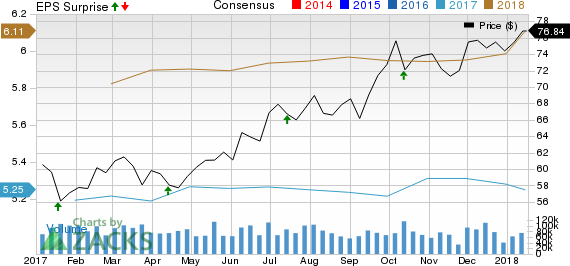
Citigroup Inc. price-consensus-eps-surprise-chart | Citigroup Inc. Quote
Currently, Citigroup carries a Zacks Rank #3 (Hold). You can see the complete list of today’s Zacks #1 Rank (Strong Buy) stocks here.
Competitive Landscape
Wells Fargo’s (NYSE:WFC) fourth-quarter 2017 adjusted earnings of 97 cents per share improved from the prior-year quarter earnings of 96 cents. The Zacks Consensus Estimate was $1.04.
Including $3.35 billion after-tax benefit, or 67 cents, from the Tax Cuts & Jobs Act, $848 million pre-tax gain, or 11 cents from the sale of Wells Fargo Insurance Services and $3.25 billion pre-tax expense, or 59 cents related to litigation accruals, net income came in at $6.2 billion or $1.16 per share.
Amid an expected trading weakness, strong investment banking results and higher rates drove JPMorgan’s (NYSE:JPM) fourth-quarter 2017 earnings of $1.76 per share, which handily surpassed the Zacks Consensus Estimate of $1.69. Results exclude one-time tax related charge of $2.4 billion or 69 cents per share.
Solid loan growth (driven mainly by improved credit card loans) and higher interest rates supported net interest income growth. Further, rise in investment banking fees and stable equity trading income supported the top line.
Riding on higher revenues, PNC Financial (NYSE:PNC) reported a positive earnings surprise of 4.1% in the fourth quarter. Adjusted earnings per share of $2.29 beat the Zacks Consensus Estimate of $2.20. Moreover, the bottom line reflected a 16.2% increase from the prior-year quarter.
Continued easing of pressure on net interest margin supported the company’s higher net interest income during the quarter. Also, non-interest income witnessed year-over-year growth. However, elevated expenses hurt results to some extent. Further, deterioration in credit quality was a headwind.
Today's Stocks from Zacks' Hottest Strategies
It's hard to believe, even for us at Zacks. But while the market gained +18.8% from 2016 - Q1 2017, our top stock-picking screens have returned +157.0%, +128.0%, +97.8%, +94.7%, and +90.2% respectively.
And this outperformance has not just been a recent phenomenon. Over the years it has been remarkably consistent. From 2000 - Q1 2017, the composite yearly average gain for these strategies has beaten the market more than 11X over. Maybe even more remarkable is the fact that we're willing to share their latest stocks with you without cost or obligation.
See Them Free>>
J P Morgan Chase & Co (JPM): Free Stock Analysis Report
PNC Financial Services Group, Inc. (The) (PNC): Free Stock Analysis Report
Wells Fargo & Company (WFC): Free Stock Analysis Report
Citigroup Inc. (C): Free Stock Analysis Report
Original post
Zacks Investment Research