
Independent oil and gas exploration and production firm Cimarex Energy Company (NYSE:XEC) reported second-quarter 2016 results on Aug 3, after the closing bell. The company reported earnings of 7 cents per share, which handily beat the Zacks Consensus Estimate of a penny. The reported figure was, however, lower than the year-ago earnings of 15 cents per share.
Total Revenue
In the second quarter, Cimarex Energy’s total revenue of $299 million beat the Zacks Consensus Estimate of $290 million. However, the top line decreased from $424 million a year ago.
Operational Highlights
In the quarter under review, total production averaged 974 million cubic feet equivalent (MMcfe) per day, down 5% year over year. Oil volumes plunged 21% year over year to 44.4 thousand barrels per day (MBbls/d), while natural gas volumes dipped 1% to 461.9 MMcf. Nonetheless, natural gas liquids (NGL) volumes grew 10% to 41 MBbls/d.
CIMAREX ENERGY Price, Consensus and EPS Surprise
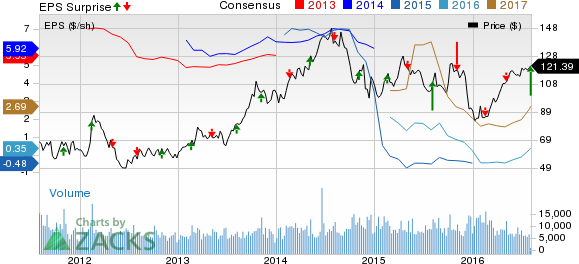
CIMAREX ENERGY Price, Consensus and EPS Surprise | CIMAREX ENERGY Quote
In the second quarter, realized prices for natural gas declined 27% to $1.82 per thousand cubic feet, for crude decreased 21% to $40.07 per barrel, and for NGL fell 5% to $13.93 per barrel all on a year-over-year basis.
Financial Condition
Cimarex Energy had cash and cash equivalents of $641.7 million as of Jun 30, 2016. Long-term debt (net of unamortized debt issuance costs) was $1.5 billion as of Jun 30, 2016, which represents a debt-to-capitalization ratio of 39.5%.
Cimarex Energy's net cash from operating activities during the quarter was $128.6 million compared with $257.4 million in the prior-year period. The company invested $156 million in exploration and development during the second quarter, which was primarily funded with cash flow from operations and cash in hand.
Guidance
Third-quarter total production is projected in the range of 950–980 MMcfe per day. Full-year 2016 production is estimated to average 980–1,000 MMcfe per day. Capital investment for exploration and development is estimated to be $750 million for 2016.
Zacks Rank
Cimarex Energy currently holds a Zacks Rank #2 (Buy). Other favorably placed stocks in the oil and gas sector include GeoPark Limited (NYSE:GPRK) , Sasol Ltd. (NYSE:SSL) and North Atlantic Drilling Limited (NYSE:NADL) . Each of these stocks sports a Zacks Rank #1 (Strong Buy).
SASOL LTD -ADR (SSL): Free Stock Analysis Report
CIMAREX ENERGY (XEC): Free Stock Analysis Report
GEOPARK LTD (GPRK): Free Stock Analysis Report
NORTH ATL DRILG (NADL): Free Stock Analysis Report
Original post
Zacks Investment Research