Yesterday was simply more of the same. Low volume, low volatility, and prices grinding ever higher seems to be the norm these days and certainly for the past 6 – 8 trading sessions. I would not be surprised if we see this kind of action all the way through the rest of August until we get closer to the Jackson Hole summit by the Fed at the beginning of September.
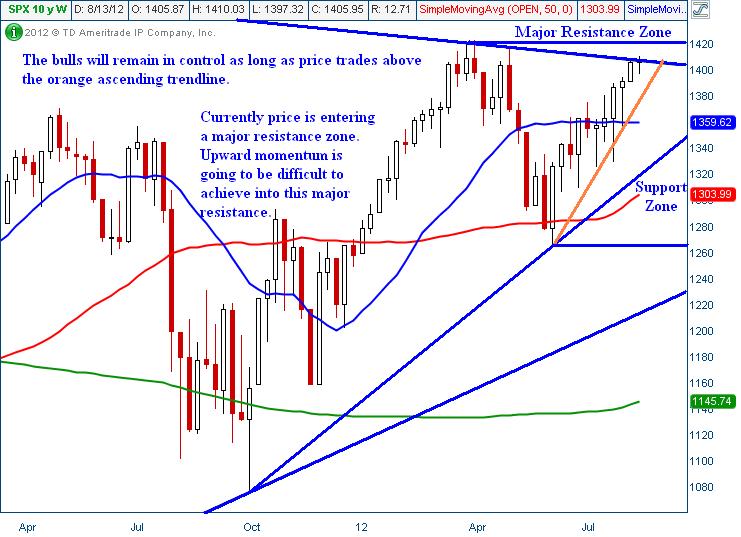
The price action is just slowly grinding into major resistance levels. The S&P 500 Index has a plethora of resistance levels overhead and the price action appears likely to test some if not all of those levels. If nothing changes, it would not at all be surprising to see prices test the 1,420 – 1,430 range in the S&P 500 Index. Should prices reach that level they will be at the 2012 highs as shown on the daily chart below.
S&P 500 Index Daily Chart
As can be seen, there are several levels of resistance overhead. Should the 1,420 – 1,430 range give way to higher prices the next logical resistance level would be around 1,440 – 1,450. As far as support is concerned, the S&P 500 bears need to see prices push through the 1,390 area just to get some momentum going. The bears are slowly but surely being killed in a death by a thousand cuts type of action.
The Nasdaq Composite and the Russell 2000 Index are both trading slightly higher on the session as well as all 3 major U.S. domestic indices trade to the upside again today. The Dow Jones Transports (IYT) and the financials (XLF) were both trading higher yesterday which is also a positive for equity bulls.
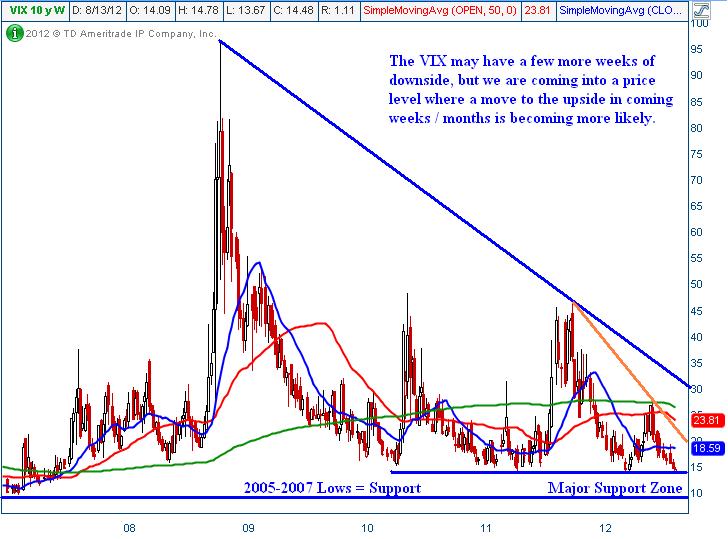
The Volatility Index (VIX) tested the 2012 lows on Monday and yesterday we are saw a strong advance to the upside, however the intraday advance was well off of the session highs as can be seen below.
Volatility Index Weekly Chart
If the S&P 500 Index breaks below the 2012 VIX low the next logical level of support is around the 9 – 10 range that was a major support area back in 2005 through most of 2007. The bears need to defend the current VIX support level to have even a remote chance at reversing price action later this month.
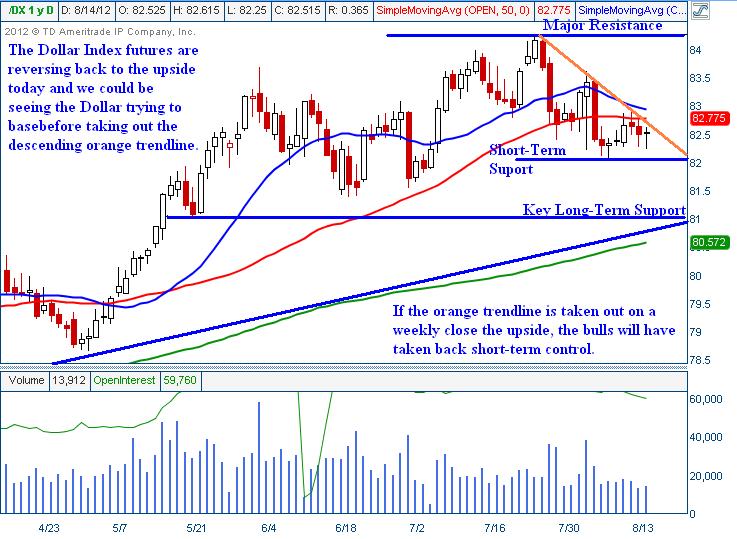
The Dollar Index futures are trying to reverse the selling pressure seen earlier yesterday and in the overnight session and at the moment have totally flipped the switch into positive territory. This price action looks quite strong in light of the recent action and can lead to higher prices if the intraday strength is sustained. The daily chart shown below demonstrates the key descending trendline that the bulls must recapture to put any pressure on the bears.
Dollar Index Futures Daily Chart
The key support level for the Dollar Index futures at the moment is around the 81 – 82 price range. If prices work below 81, the 200 period moving average will be all that stands in the way of more selling pressure down to the 2012 lows.
Precious metals are both under selling pressure with gold showing some serious intraday volatility. Both gold and silver futures sold off sharply but found major support at key moving averages. As long as prices hold above the key moving averages, a move to the upside cannot be ruled out.
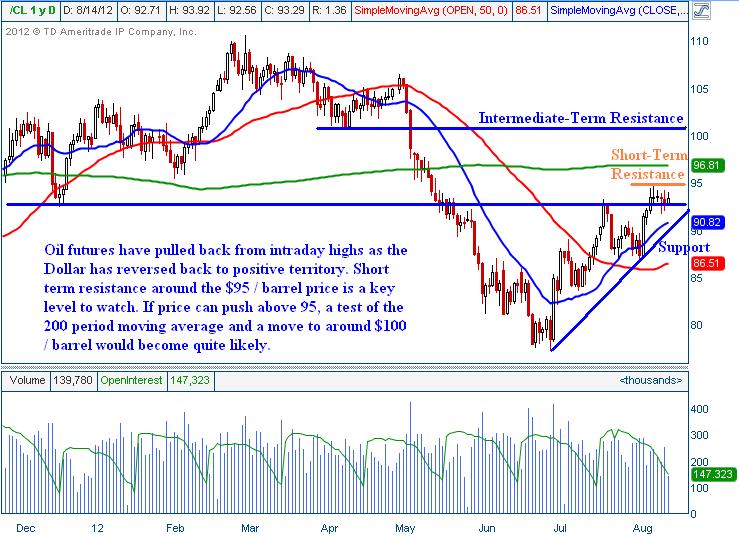
Oil futures have also pulled back from intraday highs as the Dollar flexes its muscles. Oil could pullback all the way to the rising trendline shown below and maintains a bullish bias until the ascending trendline is broken on a weekly close.
Oil Futures Daily Chart
If price can push above the $95 / barrel price level, a test of the 200 period moving average followed by a possible move as high as $100 / barrel in short order. Oil prices were surging earlier yesterday until the Dollar found major strength and started to reverse the action.
It is important to point out the weakness being seen in the 10 & 30 Year Treasury futures yesterday. In both cases, treasury’s are clearly for sale. If both the 10 & 30 year bonds break down below support levels immediately underneath price and even stronger waves of selling could set in. I don’t know what this selling truly means or if it means anything, but at the moment the selling pressure cannot be ignored.
Overall, the market in general is pretty quiet. However we have more mixed signals with equities trading higher while the VIX moves north as well. Furthermore, the U.S. Dollar Index futures are positive and the VIX has lost much of the morning gains. The Dollar is surging at the moment and putting pressure on risk assets, if for some reason the Dollar loses its luster things could get quite interesting into the bell. This market is interesting, on bad news this marketplace wants to rally, on good news they want to rally, but bad news is to be ignored.
In closing, this market is dull and dull markets should never be shorted!
- English (UK)
- English (India)
- English (Canada)
- English (Australia)
- English (South Africa)
- English (Philippines)
- English (Nigeria)
- Deutsch
- Español (España)
- Español (México)
- Français
- Italiano
- Nederlands
- Português (Portugal)
- Polski
- Português (Brasil)
- Русский
- Türkçe
- العربية
- Ελληνικά
- Svenska
- Suomi
- עברית
- 日本語
- 한국어
- 简体中文
- 繁體中文
- Bahasa Indonesia
- Bahasa Melayu
- ไทย
- Tiếng Việt
- हिंदी
Chop-Fest Continues: Equities Trade Higher While The VIX Moves North
Published 08/15/2012, 03:25 AM
Updated 07/09/2023, 06:31 AM
Chop-Fest Continues: Equities Trade Higher While The VIX Moves North
3rd party Ad. Not an offer or recommendation by Investing.com. See disclosure here or
remove ads
.
Latest comments
Install Our App
Risk Disclosure: Trading in financial instruments and/or cryptocurrencies involves high risks including the risk of losing some, or all, of your investment amount, and may not be suitable for all investors. Prices of cryptocurrencies are extremely volatile and may be affected by external factors such as financial, regulatory or political events. Trading on margin increases the financial risks.
Before deciding to trade in financial instrument or cryptocurrencies you should be fully informed of the risks and costs associated with trading the financial markets, carefully consider your investment objectives, level of experience, and risk appetite, and seek professional advice where needed.
Fusion Media would like to remind you that the data contained in this website is not necessarily real-time nor accurate. The data and prices on the website are not necessarily provided by any market or exchange, but may be provided by market makers, and so prices may not be accurate and may differ from the actual price at any given market, meaning prices are indicative and not appropriate for trading purposes. Fusion Media and any provider of the data contained in this website will not accept liability for any loss or damage as a result of your trading, or your reliance on the information contained within this website.
It is prohibited to use, store, reproduce, display, modify, transmit or distribute the data contained in this website without the explicit prior written permission of Fusion Media and/or the data provider. All intellectual property rights are reserved by the providers and/or the exchange providing the data contained in this website.
Fusion Media may be compensated by the advertisers that appear on the website, based on your interaction with the advertisements or advertisers.
© 2007-2024 - Fusion Media Limited. All Rights Reserved.
