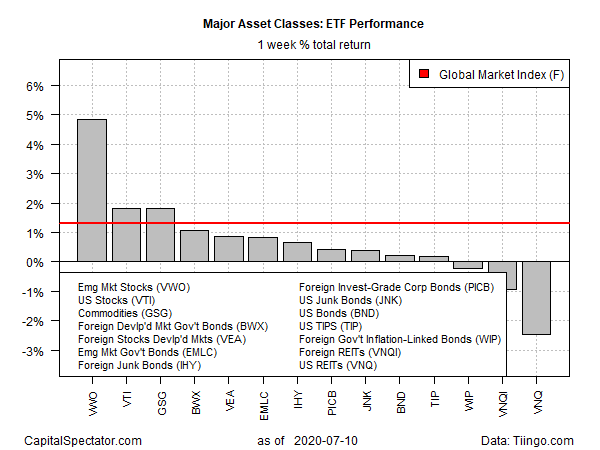
Equity prices in emerging markets posted the strongest gain for the major asset classes for the trading week through Friday, July 10, based on a set of US-listed exchange traded funds.
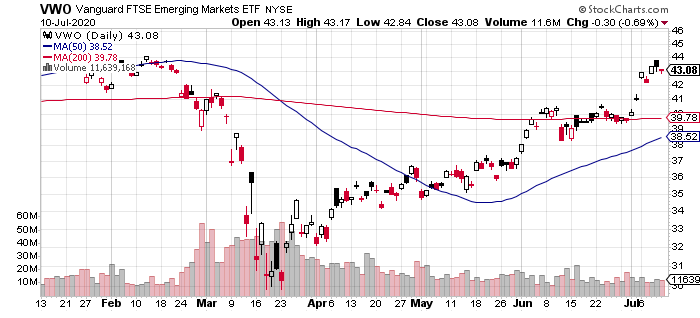
Vanguard FTSE Emerging Markets (NYSE:VWO) rose 4.8% last week – the strongest weekly gain for the fund in five weeks. As of Friday’s close, VWO had recovered nearly all the losses suffered in March’s dramatic correction.
Driving VWO’s rally: a sharp gain in Chinese stocks. Equities in China account for more than 40% of VWO’s portfolio, according to Vanguard data as of May 31.

China’s equity market rally continues today (July 13) and analysts are expecting the bullish trend to persist for the near term. “The upward trend remains intact,” wrote Hao Hong of Bocom International Holdings in Hong Kong in a research note.
“The general mantra from the top remains supportive of the market. It helps the domestic sentiment, strengthens the national resolve, and finances capital investment into new and innovative industries.”
Ivan Li, a money manager at Shanghai-based Loyal Wealth Management, also sees higher prices ahead. “Market sentiment remains strong as ample cash flowing to A-share stocks cemented investors’ belief that the rally would not end soon,” he tells South China Morning Post, adding:
“Risks are increasing since fundamentals may not be able to support the lofty prices.”
The worst performer for the major asset classes last week: US real estate investment trusts (REITs). Vanguard Real Estate (NYSE:VNQ) fell a hefty 2.5% after a strong rally in the previous week.
The widespread gains in markets last week lifted the Global Markets Index (GMI.F). This unmanaged benchmark, which holds all the major asset classes (except cash) in market-value weights via ETFs, rose 1.3% — the index’s second straight weekly advance.

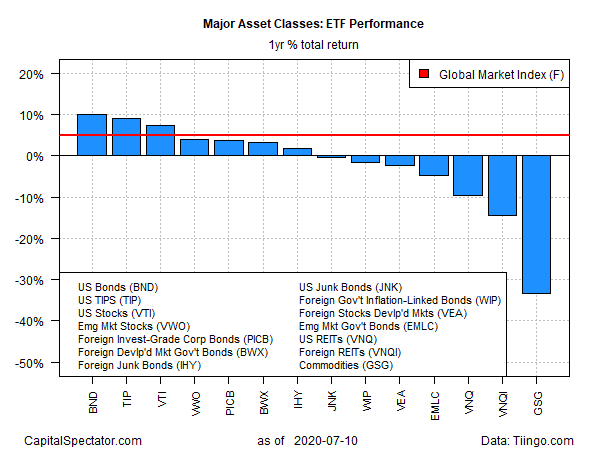
For the one-year trend, US investment-grade bonds continue to lead the major asset classes. Vanguard Total Bond Market (BND) posted a strong 9.8% total return for the trailing 12-month period at last week’s close.
Broadly defined commodities remain the worst one-year performer. The iShares S&P GSCI Commodity-Indexed Trust (NYSE:GSG) was in the hole by nearly 34% at last week’s close vs. the year-earlier price.
GMI.F’s one-year total return, by contrast: a moderate 4.9% gain.

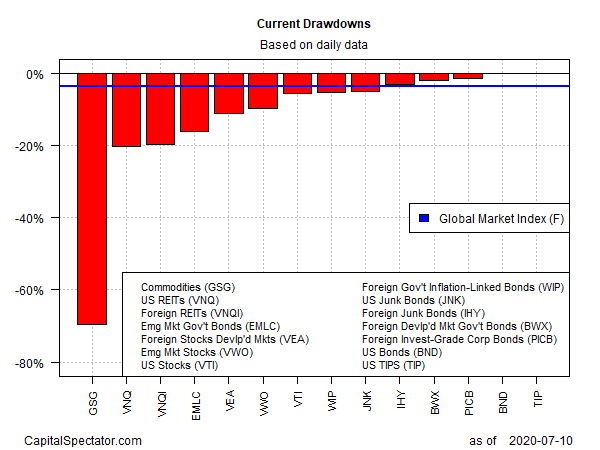
Ranking asset classes by current drawdown continues to show a wide range of results, ranging from a near-70%-plus peak-to-trough decline for commodities (GSG) to a close-to-zero drawdown for inflation-indexed Treasuries (NYSE:TIP).
GMI.F’s current drawdown: a modest -3.7%.

