
Chegg, Inc. (NYSE:CHGG) reported better-than-expected fourth-quarter 2017 results.
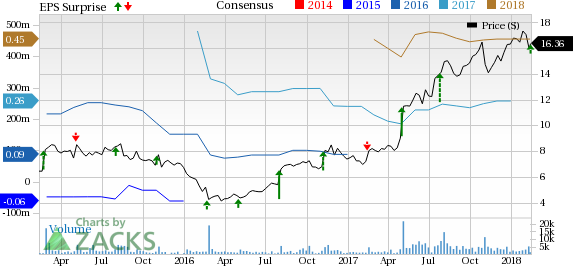
Adjusted earnings of 6 cents per share surpassed the Zacks Consensus Estimate of 4 cents by 50% and increased from the prior-year quarter’s breakeven earnings. The significant improvement in profitability was driven by the company’s strong digital model in providing students with modern education.
Net revenues of $73.5 million surpassed the consensus estimate of $70.5 million by 4.3% and increased 17% year over year. The revenues growth was primarily favored by increase in Chegg Services revenues.
Chegg, Inc. Price, Consensus and EPS Surprise
Post the earnings release, shares of Chegg grew over 5% in after-hours trading on Feb 12. Also, the company’s shares rallied 104.5% in the past year, outperforming the industry’s gain of 22.3%.
Let’s delve deeper into the numbers.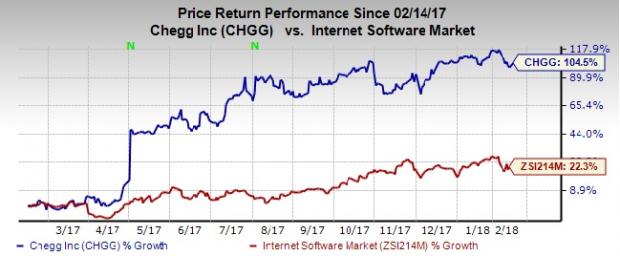
Chegg Services Revenues & Subscription Details
Chegg’s total net revenues are derived from two streams, namely, Chegg Services revenues and Required Materials revenues.
Chegg Services revenues of $60.5 million increased 37% year over year and was slightly above the projected range of $58-$59 million. The Chegg Services subscriber base totaled 1.4 million in the quarter, hitting a record 47% growth year over year. The upside was driven by the company’s investment in new content and expansion of modalities that attracted greater number of students.
Total Chegg Study content views increased 79% year over year to 169 million.
Operating Highlights
Gross profit of $54.1 million in the quarter increased 27.4% from the year-ago level. Gross margin of 73.6% was higher than the prior-year quarter and the company’s expectations, courtesy of incremental revenues from Chegg Services.
Adjusted EBITDA of $21.1 million shows a substantial improvement from the year-ago level by improving 52%. The figure is also above the company’s earlier expectations of $19-$20 million.
Adjusted net income for the quarter was $18.1 million.
Balance Sheet
Chegg had cash and cash equivalents of $126.5 million for the period ending Dec 31, 2017, compared with $77.3 million as of Dec 31, 2016.
The quarterly cash flow came in above management’s expectations at $15.5 million. The year ended with cash and investments of $229 million, almost three times greater than that at the end of 2016.
2017 Results
Total net revenues of $255.1 million remained flat year over year. Chegg Services Revenues grew 44% year over year to $185.7 million. Net Loss was $20.3 million in 2017 whereas Adjusted EBITDA came in at $46.4 million. Chegg Services subscribers increased 45% year over year to 2.2 million and total Chegg Study content views grew 69% to 440 million, compared with the prior year.
First-Quarter 2018 Guidance
Net revenues are expected in the range of $73-$75 million, whereas Chegg Services Revenues are anticipated in the range of $54-$55.5 million. Gross margin is expected to increase between 71% and 73%, and adjusted EBITDA is projected within $14-$16 million.
2018 Guidance Lift
For 2018, the company expects net revenues in the range of $295-$300 million, higher than the previously expected number of $295 million. Chegg Services Revenues are anticipated to be within $240-$243 million, up from previously guided $240 million.
Gross margin between 72% and 74% is expected for the year, same as previously assumed. The company expects adjusted EBITDA in the range of $74-$76 million.
Capital expenditures are expected within $30-$35 million.
Zacks Rank and Stocks to Consider
Chegg has a Zacks Rank #3 (Hold).
A few better-ranked stocks in the Computer and Technology sector are Nice Systems (NASDAQ:NICE) , Rockwell Automation (NYSE:ROK) and Cray Inc (NASDAQ:CRAY) , each carrying a Zacks Rank #2 (Buy). You can see the complete list of today’s Zacks #1 (Strong Buy) Rank stocks here.
Nice System, Rockwell Automation and Cray’s earnings for 2018 are expected to grow 11.2%, 14.6% and 26.7%, respectively.
The Hottest Tech Mega-Trend of All
Last year, it generated $8 billion in global revenues. By 2020, it's predicted to blast through the roof to $47 billion. Famed investor Mark Cuban says it will produce "the world's first trillionaires," but that should still leave plenty of money for regular investors who make the right trades early.
See Zacks' 3 Best Stocks to Play This Trend >>
Chegg, Inc. (CHGG): Free Stock Analysis Report
Nice Systems Ltd. (NICE): Free Stock Analysis Report
Cray Inc (CRAY): Free Stock Analysis Report
Rockwell Automation, Inc. (ROK): Free Stock Analysis Report
Original post
Zacks Investment Research