Get 40% Off
⚠ Earnings Alert! Which stocks are poised to surge?
See the stocks on our ProPicks radar. These strategies gained 19.7% year-to-date.
Unlock full list

4 Charts To Watch: Iron Ore Continues To Lead Industrial Metals Rally

Published 02/10/2017, 05:59 AM
Updated 07/09/2023, 06:31 AM

Here are a few of the charts that currently have my attention:

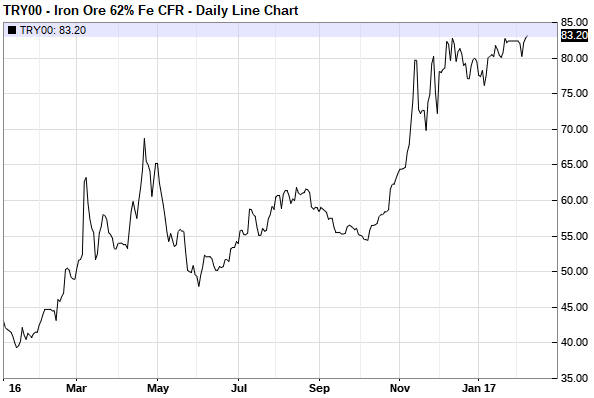
1) The industrial metals bottomed (in price) as a group early last year. They were then led higher as a group by iron-ore, the metal that according to many analysts had the most bearish fundamentals and could therefore not sustain a rally.

The following chart (from barchart.com) shows that the iron-ore price has more than doubled since its early-2016 bottom. It made a marginal new high this week, so there is no evidence yet that the rally is over.

When the iron-ore price eventually reverses it will be a warning that the broad-based industrial-metals rally is close to an end.
Iron Ore Daily Chart

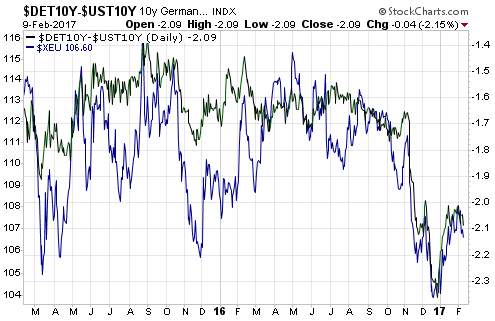
2) The following chart compares the euro with the difference in yield between 10-year German Government bonds and 10-year US Treasury notes. The euro has tracked this interest-rate differential quite closely over the past two years and very closely over the past 6 months.

The implication is that for the euro to extend its short-term rebound, German yields will have to remain in an upward trend relative to US yields. How likely is that?
German 10-Year Yield Vs U.S. 10-Year Yield Daily Chart

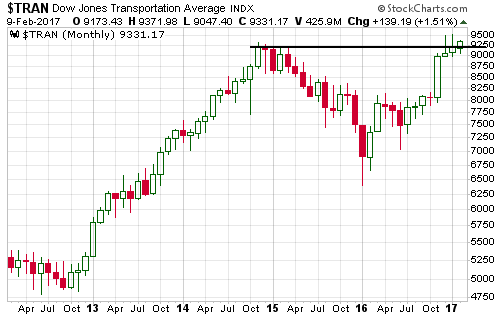
3) The Dow Transportation Average (TRAN) traded comfortably above its November-2014 high during December-2016 and January-2017, but in each case it failed to give a monthly close above the November-2014 close. This means that TRAN still hasn’t broken above its 2014 peak on a monthly closing basis, which represents an interesting non-confirmation of the breakouts achieved by other indices.

Will TRAN finally break out on a monthly basis this month?
TRAN Monthly Chart

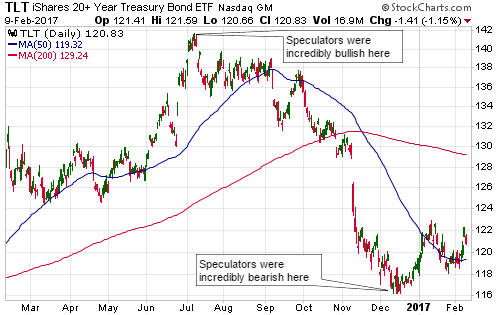
4) In early-July of last year the Commitments of Traders (COT) data indicated that speculators were as bullish as they ever get on long-dated Treasury securities (via NASDAQ:TLT). This set the stage for an important price top. By December the sentiment situation had shifted 180 degrees, with the COT data indicating that speculators were as bearish as they ever get on long-dated Treasury securities. The stage was therefore set for an important price bottom.

The recovery from the December-2016 bottom is probably not yet close to being over.
TLT Daily Chart

Latest comments

Risk Disclosure: Trading in financial instruments and/or cryptocurrencies involves high risks including the risk of losing some, or all, of your investment amount, and may not be suitable for all investors. Prices of cryptocurrencies are extremely volatile and may be affected by external factors such as financial, regulatory or political events. Trading on margin increases the financial risks.
Before deciding to trade in financial instrument or cryptocurrencies you should be fully informed of the risks and costs associated with trading the financial markets, carefully consider your investment objectives, level of experience, and risk appetite, and seek professional advice where needed.
Fusion Media would like to remind you that the data contained in this website is not necessarily real-time nor accurate. The data and prices on the website are not necessarily provided by any market or exchange, but may be provided by market makers, and so prices may not be accurate and may differ from the actual price at any given market, meaning prices are indicative and not appropriate for trading purposes. Fusion Media and any provider of the data contained in this website will not accept liability for any loss or damage as a result of your trading, or your reliance on the information contained within this website.
It is prohibited to use, store, reproduce, display, modify, transmit or distribute the data contained in this website without the explicit prior written permission of Fusion Media and/or the data provider. All intellectual property rights are reserved by the providers and/or the exchange providing the data contained in this website.
Fusion Media may be compensated by the advertisers that appear on the website, based on your interaction with the advertisements or advertisers.
© 2007-2024 - Fusion Media Limited. All Rights Reserved.