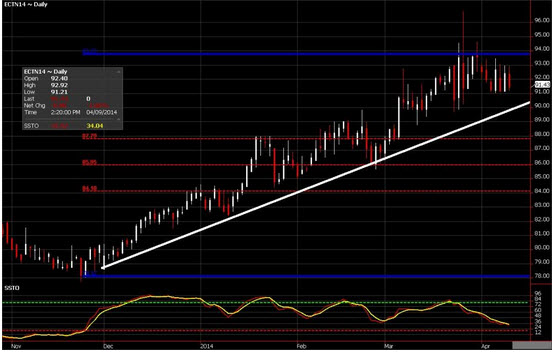
Cotton prices have continued to grind higher since the beginning of December as one can see by the chart below. In this time frame, prices of July futures have appreciated approximately 17%, lifting trade to their highest levels in 27 months—near 97 cents/lb. This likely has something to do with the most recent US cotton harvest being the smallest in 4 years. Add to that the fact that there appears to be an appetite for Ag commodities among speculators and funds alike.
In recent weeks cotton remains range-bound in a sideways market, consolidating just above 90 cents. A penetration of the up-sloping trend line identified by the white line would be a game changer in my eyes. We are seeing the roll from May futures to July keeping the market afloat, but as that slows and/or the trend turns I expect the depreciation to accelerate.
The fact that cotton prices are breaking down in the face of the recent dollar weakness is another feather in the bears' hats. There are a number of bearish fundamental factors to keep an eye on as I await a technical confirmation: Exchange certified deliverable stocks are increasing (near 266,000 bags); Acres will increase as higher pricing has enticed farmers to shift more acres towards cotton as the USDA reported; Further speculation that ending stocks could double in the coming season if Mother Nature cooperates.
Let's also throw into the mix a seasonal tendency. While past performance is NOT indicative of future results I try to recognize patterns. Selling July cotton futures on or about 4/7 and covering on or about 5/4 has been a profitable transaction 14 out of the last 15 years, to the tune of 4.7 cents. Translation in cotton: $500 x 4.7 = $2,350. Will we be celebrating on Cinco de Mayo that this transaction worked in 2014? Time will tell. As I said above, past performance is not indicative of futures results. However, I like the idea of bearish trade and will be using the Fibonacci levels to help navigate my client's exit.

Disclaimer: This information is not to be construed as an offer to sell or a solicitation or an offer to buy the commodities and/ or financial products herein named. The factual information of this report has been obtained from sources believed to be reliable, but is not necessarily all-inclusive and is not guaranteed to be accurate. You should fully understand the risks associated with trading futures, options and retail off-exchange foreign currency transactions (“Forex”) before making any trades. Trading futures, options, and Forex involves substantial risk of loss and is not suitable for all investors. You should carefully consider whether trading is suitable for you in light of your circumstances, knowledge, and financial resources. You may lose all or more than your initial investment. Opinions, market data, and recommendations are subject to change without notice. Past performance is not necessarily indicative of future results. This report contains research as defined in applicable CFTC regulations. Both RCM Asset Management and the research analyst may have positions in the financial products discussed.