by Pinchas Cohen
It’s coming. August first. As the dreaded scaling debate deadline for Bitcoin approaches, the cryptocurrency declines, as its chain-split risk rises.
The Harder They Fall
After investors made 800-percent on the digital currency, from its May 2015 $20 price to its current $2,056 or even 'just' 137-percent since the cryptocurrency's $734 January low, it is high time for a correction, any way you slice it.
Some go further, recalling the 2000 tech bubble, comparing the current situation to investors’ overwhelming greed for big profits, fast.

Beware Volatility
We predicted a decline on May 23. That day the price reached a high of $2,474.7. Since then, Bitcoin has moved up an additional 23 percent to $3,000. On June 19, we once again forecast a decline. We suggested that due to its volatile nature, filters should be multiplied by ten. So a 20 percent move should be considered as a 2 percent filter for a normal asset.
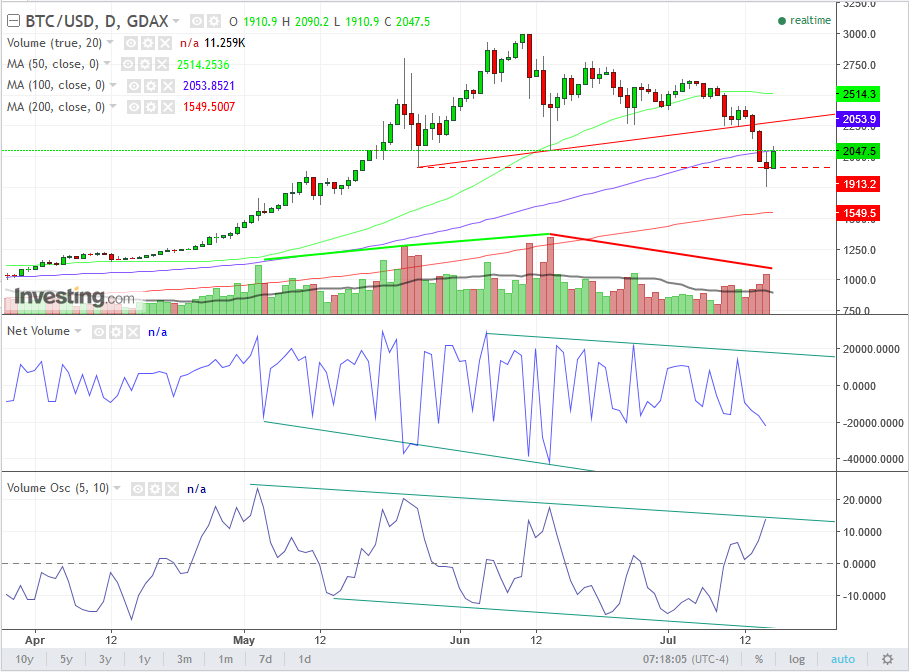
On July 13, Bitcoin's trading pattern completed a H&S top. In retrospect, our May 23 forecast proved to be the left shoulder, and the June 17 forecast proved to be the beginning of the right shoulder, upon the completion of the head.
Selloff and Panic
Since then, the price has fallen below the $2,514 50 dma (green) on July 9 and below the $2,053 100 dma (blue) on July 14. Last Thursday, July 10, the price attempted to cross over the 100 dma, but touching that line was like touching a live wire.
The price looks like its hair is spiked in shock, as it formed a high-wave candle, rising, falling, but closing near the open—the telltale sign of investors rushing around in panic on any and every rumor and shadow. Today, the cryptocurrency's price peaked above the 100 dma, but was forced back below, where it sits at $2,052.8 as of 6:30 EDT, just 10-cents below the 100 dma.
A few weeks ago the financial media was on fire about oil and its 20 percent decline, when the commodity turned into a bear market. Bitcoin has declined more than 40 percent from its $3,000 peak to Friday’s $1,759 low, but as mentioned above, the extraordinarily volatile nature of this asset may require multiplying gauges by 10, which suggests that only a 200 percent decline would turn the digital currency into a bear market.
Minimum Target Price
A $650 move from the crossing of the $2,250 reversal line to $1,600, or about a 29 percent decline. Should the target price materialize, Bitcoin would have declined 47 percent, putting it deep within a bear conventional market.
Return Move
Today’s rise is considered a return move and is classic after a H&S top, as the price retests the now-resistance of the pattern’s rising reversal line, at $2,300 per the current angle.
Note how volume has been picking up with the uptrend line, but has been declining—as demand runs dry—since the June 11, $3,000 peak of the Head. Note also that Net Volume, showing the direction of the volume’s price, is in decline. The upticks are are getting lower since the head, while the downticks have already been in decline since May. Finally, the volume oscillator—fast volume moving average minus slow volume moving average—confirms volume's falling momentum.
Trading Strategies
Conservative traders would require evidence that the return-move is complete. Ideally, it would reach the neckline, or reversal line, while demonstrating weakness confirmation in price action, volume or momentum. Conservative traders may wait on a short till the $2,300 level, or, of course, for a resumption of the downtrend, which would be signaled upon breaking the support of the July 15 $1,759.2 high-wave candle low - including price depth and/or time filters - the $1,910.9 closing price of which just so happened to be below the May 26 $1,913.2 low.
Moderate traders would wait on a short for a bearish confirmation such as a doji, signifying a weakening of the current move, a third close below the 100 dma, or a confirmation of the volume oscillator’s bearish pattern, with a downward curve from its falling channel.
Aggressive traders would short now, while allowing some padding for a return move.
Very Aggressive traders would go long now – against the primary trend – hoping to catch the return move, before shorting upon price meeting resistance, as described above.
