by Pinchas Cohen
- Will Apple Continue to Fall Far from the Tech Tree?
- Do Investors No Longer See the iPhone maker as the Apple of their eye?
- Apple as the biggest loser provides you with the opportunity to be the biggest winner

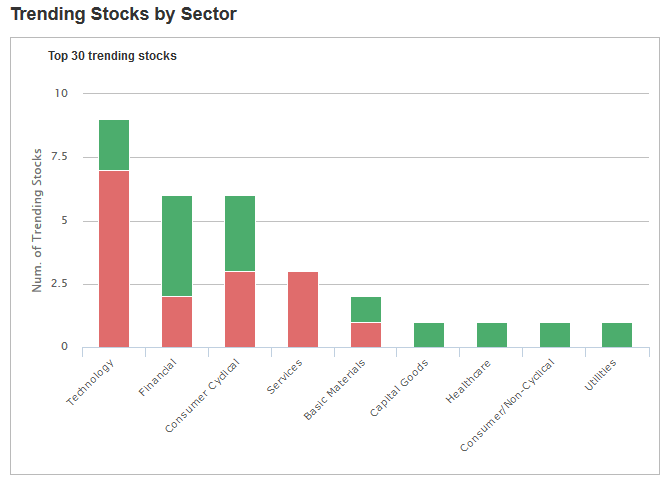
During the past few trading sessions, technology has become the most popular sector to sell. And the most popular stock to sell? That would Apple Inc (NASDAQ:AAPL).

Since Friday, when the tech sector sell-off began, Apple lost as much as 8% of its value during intraday trade, locking in a 6% decline as of last night's close. This would make Apple the biggest loser of the current sell-off. But the real question is whether it’s an opportunity for traders to become the biggest winners by getting in on a dip and riding the popular stock higher.
What Goes Up Must Come Down
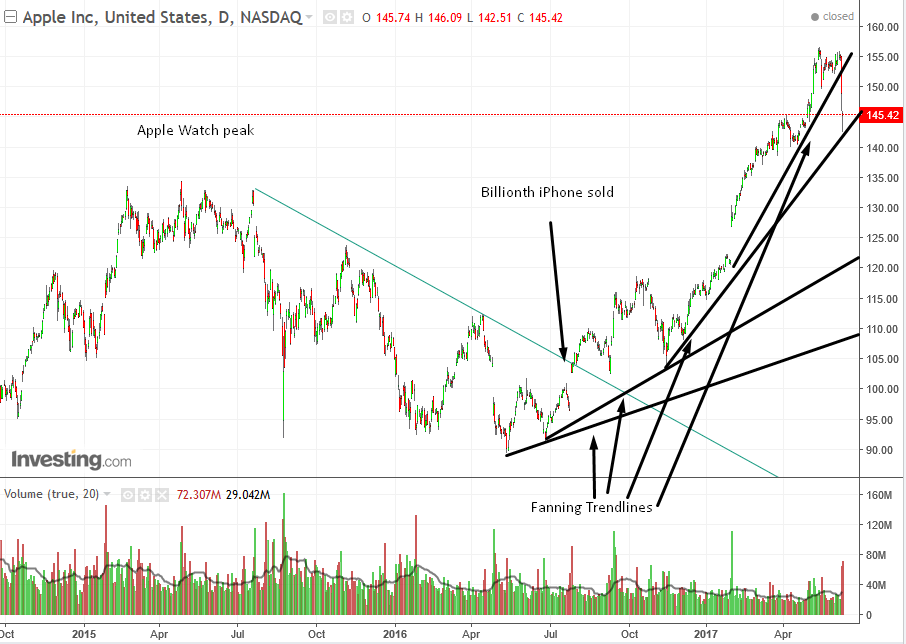
Apple’s previous top was at the $133-35 price levels,between February and July 2015, when it formed a Triple Top. On April 28, 2015, Apple shares began a fall from a high of $124.54 to the low of $89.47 on May 13, 2016. Over this time, the stock lost a third of its value on the disappointment of the Apple Watch.
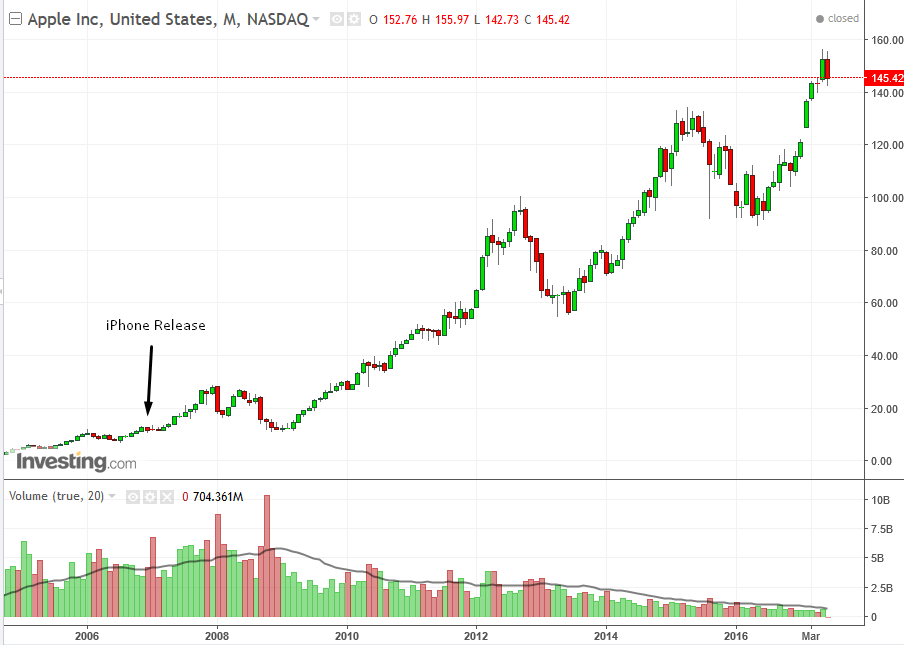
Since Steve Jobs introduced the first iPhone to the world on January 9, 2007, the value of the company's stock has risen over 11 times, from $12 to almost $135. The iPhone changed the world—and arguably the company itself—forever. And the share price and company valuation were heavily rewarded.

Of course, once the iPhone became a bit more commoditized, Investors needed to see Apple introduce the next, new big thing that would change the world forever. The introduction, in late April, 2015 of the Apple Watch unfortunately wasn’t that. It was not considered a game changer and disappointed investors rushed out of their positions, triggering a massive selloff.
Not until July 27, 2016, when Apple celebrated its one billionth iPhone sold, did the price of its shares break out of the downtrend line, after a rising breakaway gap. Later that year, Samsung’s Note 7 debacle gave Apple's stock a boost, but it wasn’t until the general US market stock mania after the US election—when the so-called Trump trade ran amuck—that Apple recovered its former market glory, by overcoming the $135 peak, set before the disappointing Apple watch release.
The tech sell-off got investors thinking it may be the prelude to an overall market crash, after Goldman Sachs released a report on Friday, comparing the similarities between current markets and market conditions right before the dotcom crash.
However, while the NASDAQ 100 lost 3% in the two-day sell off, NASDAQ’s Crude Oil Index gained 0.6 percent, since it's positively correlated with the commodity itself, which advanced during those same two days. In addition, the NASDAQ Financial 100 gained 3.6 percent during the same period—0.6 percent more than the NASDAQ 100's loss—since banks are the biggest beneficiaries of what is considered an inevitable rate hike. All things considered then, it appears the NASDAQ sell-off was probably nothing more than a sector leadership change, as investors rotate out of growth sectors and into value sectors.
But Does Whatever Goes Down Have To Go Back Up?

So where is Apple's stock likely to go now? That, of course is the trillion-dollar question, or actually the $700 billion-dollar question, the company's valuation when it peaked on February 2015.
Since Apple has catapulted higher at ever-steeper trajectories since 2007, there’s a long pathway for its macro uptrend line. The way chart analysts handle this pattern is with “fanning,” in which they create trendlines for each of the angles. When one angle is broken, the price is expected to continue to the next, less steep trendline.
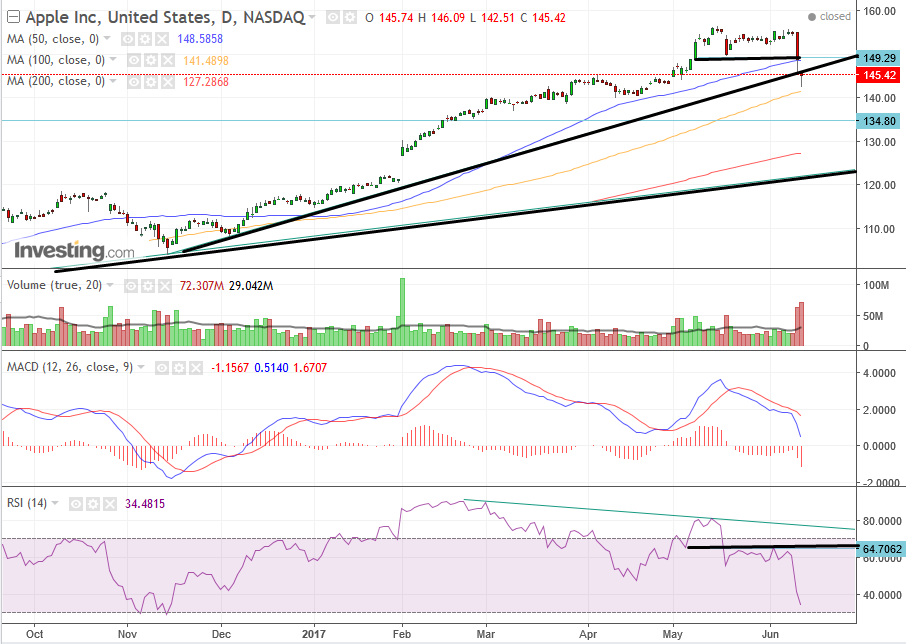
Yesterday, Apple fell through its uptrend line that's been in place since November 14, signaling the end of the Trump trade, which ignited the rally. That fall also completed a small double top, in which the May and June peaks at the $155.50 price levels formed the top, and the trough on May 17, with a low of 149.71, forms the neckline.
Price also fell through the 50 dma. Both days of the sell-off were backed by very high volume, which lends credence to the continuation of the move. The MACD's shorter moving average fell below the longer one, which in turn fell below the zero line, providing a double sell signal. This occurred on May 19, just two days after the RSI leading indicator broke down, providing a negative divergence when its May peak was lower than its February peak, as opposed to the price action of Apple stock itself.
On the other hand, the stock’s ability to climb back from the low of $142.51, which found the support of the 100 dma at $141.48, to the closing price of $145.42—forming a Hammer—suggests some investors considered it a dip and were willing to take a chance on the stock.
Will those investors push the stock higher from here, or will the tech sell-off resume? Hard to say, since investors who may have once been buyers get spooked at such crossroads, and may continually change sides as fear and/or greed drives them.
Stock rotations more often than not play out over time, driven not by the knee-jerk selling of the uninitiated but rather by the actions of savvy investors who know that just because one sector falls, it doesn’t mean it’s over for the stock market. Our assessment then is that the rotation’s trend will resume. From a technical standpoint, the breaking of the uptrend line since the US election rally and the completing of the small Double Top suggests the trend of that duration is over. The volume, MACD and the RSI support that.
Trading Strategies
Conservative traders would respect yesterday’s hammer and wait for a correction on its potential bounce back with a return move toward the resistance of the broken uptrend line and neckline, and maybe even the psychological resistance of the $150 price level. Should there be no correction, they would wait for the hammer’s and 100 dma support to be broken at $141.48.
Cautious traders would wait for a close below the support of the $140 round number. A good place for stop losses would be above those supports, which are expected to turn into resistance.
Moderate traders may wait on a short to yesterday’s intraday high of $146.09, on a correction, or for the hammer’s and 100dma at 141.48 to be broken.
Aggressive traders would short now.
