Get 40% Off
👀 👁 🧿 All eyes on Biogen, up +4,56% after posting earnings. Our AI picked it in March 2024.
Which stocks will surge next?
Unlock AI-picked Stocks

Chart Of The Day: Trading Oil's Short-Term Comeback

Published 06/07/2017, 07:45 AM
Updated 09/02/2020, 02:05 AM

by Pinchas Cohen

Oil Daily

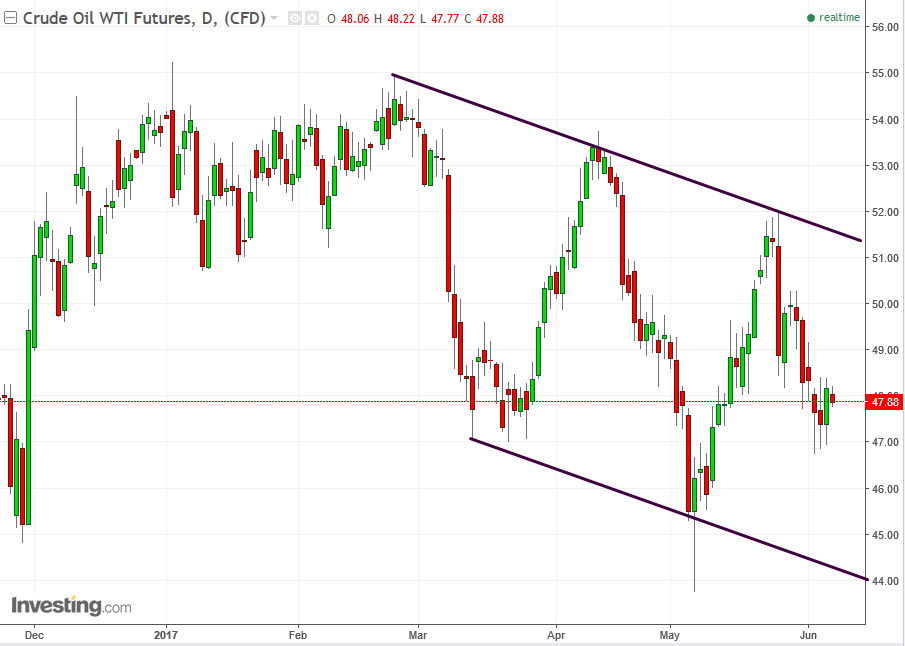
While oil remains imprisoned within a downward spiral of a falling channel, as discussed previously, yesterday’s bounce erased any losses from the previous two sessions, with a close of $48.19. This set up a strong Bullish Engulfing Pattern.

Here's a closer look…
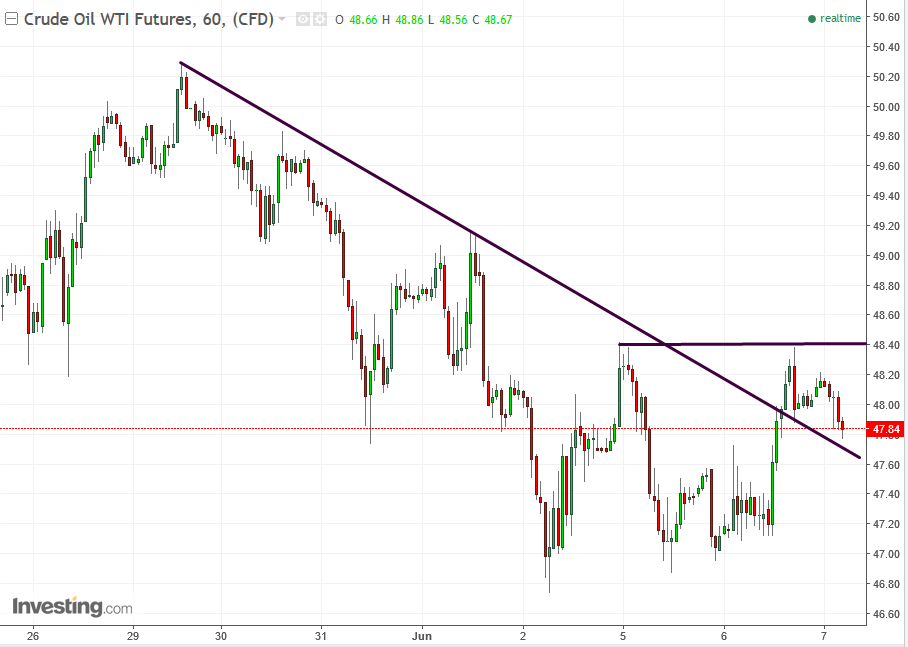
Oil 60-Minute Chart

Yesterday’s 1.67% daily advance and 2.66% daily reversal helped the price break above its hourly falling trend at 14:00 EDT, reaching a high of $48.40. At 16:00 EDT the price tested the violated downtrend line, with a low of $47.87, right on the line, and bounced. At 2:00 EDT it retested that line and bounced within the same hour, forming a hammer’s support at the low of $47.84. In the following two hours, the price experienced pressure, but it held, and as of this writing is still holding, right on the pip.

Trading the Bullish Engulfing Pattern

While the general trend’s impetus is still down, the daily two-day Bullish Engulfing Pattern—translated into a short term upside breakout of the falling channel on the hourly chart—presents a one-in-a-hundred trade of a risk-reward ratio, as the price is right on the support of the hammer. Of course it's important to understand the price may still dip lower, as it retests the broken downtrend line. At this angle, it’s at $47.65. Below that may be a good place for a short stop loss.

Oil Without the Dollar Risk

Whether one is bullish or bearish oil, many traders are currently bearish on the US dollar. Should that be the case, there's TOPIX Oil & Coal Products, a Japanese oil ETF whose base currency is the safe haven Japanese yen. You can trade up the oil-tracking ETF short-term and trade it down longer term. Either way, you’d have to buy the yen to do so.
3rd party Ad. Not an offer or recommendation by Investing.com. See disclosure here or remove ads .

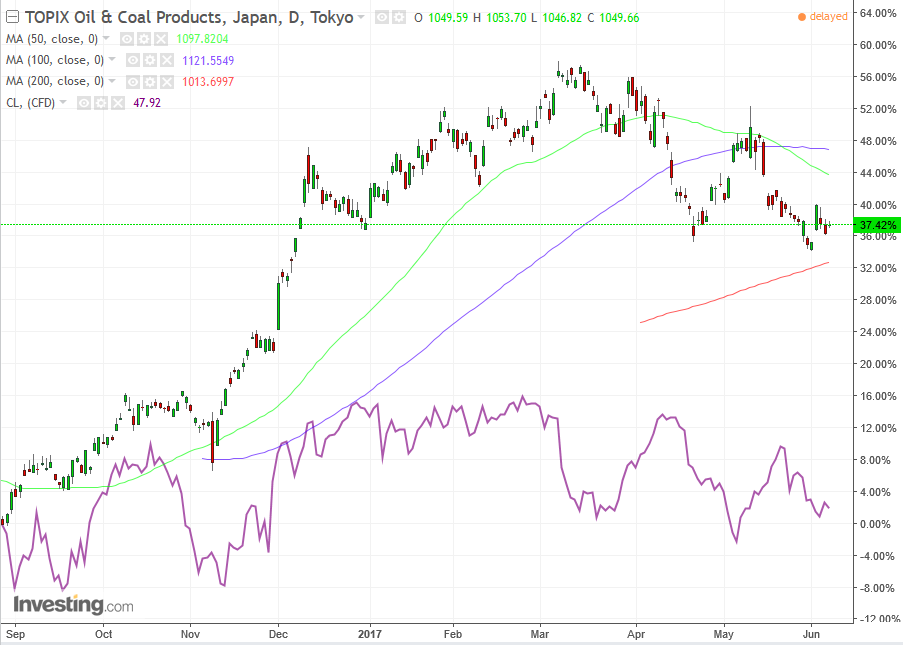
TOPIX Oil & Coal vs Oil Price Daily

The ETF has been largely tracking oil’s movements, displayed at the bottom of the chart in purple. The ETF’s 50 dma crossed below the 100 dma on May 24; the price must cross below the 200 dma, at 1010 yen, per this angle.
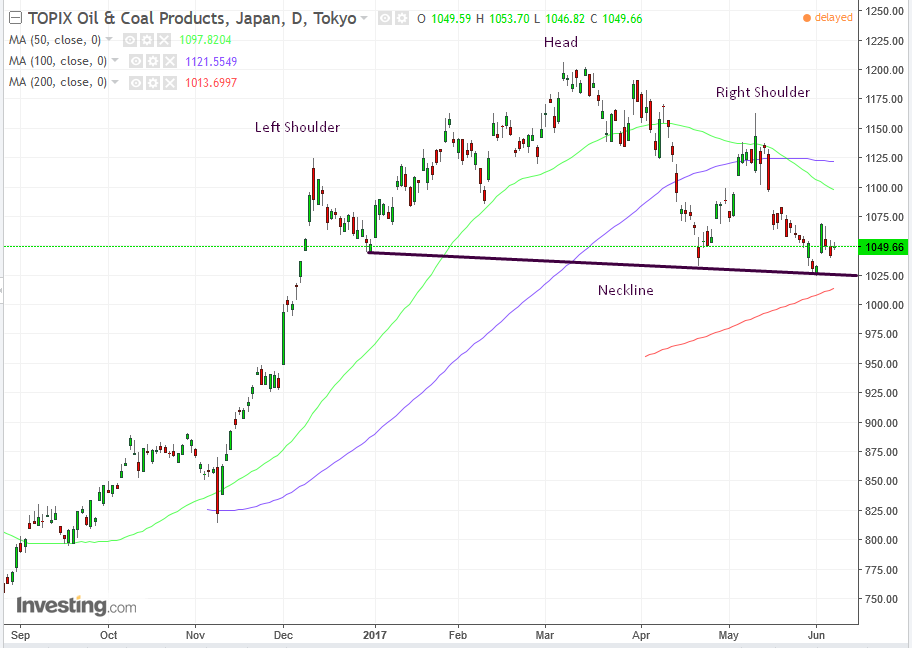
TOPIX Oil & Coal Daily

That would also break down a massive H&S top that began forming in December. The height of the pattern suggests a massive follow-up move of 11.5%.

Latest comments

Yeah, right.
Risk Disclosure: Trading in financial instruments and/or cryptocurrencies involves high risks including the risk of losing some, or all, of your investment amount, and may not be suitable for all investors. Prices of cryptocurrencies are extremely volatile and may be affected by external factors such as financial, regulatory or political events. Trading on margin increases the financial risks.
Before deciding to trade in financial instrument or cryptocurrencies you should be fully informed of the risks and costs associated with trading the financial markets, carefully consider your investment objectives, level of experience, and risk appetite, and seek professional advice where needed.
Fusion Media would like to remind you that the data contained in this website is not necessarily real-time nor accurate. The data and prices on the website are not necessarily provided by any market or exchange, but may be provided by market makers, and so prices may not be accurate and may differ from the actual price at any given market, meaning prices are indicative and not appropriate for trading purposes. Fusion Media and any provider of the data contained in this website will not accept liability for any loss or damage as a result of your trading, or your reliance on the information contained within this website.
It is prohibited to use, store, reproduce, display, modify, transmit or distribute the data contained in this website without the explicit prior written permission of Fusion Media and/or the data provider. All intellectual property rights are reserved by the providers and/or the exchange providing the data contained in this website.
Fusion Media may be compensated by the advertisers that appear on the website, based on your interaction with the advertisements or advertisers.
© 2007-2024 - Fusion Media Limited. All Rights Reserved.