Video-conference darling Zoom (NASDAQ:ZM) fell Monday, to $15.57, or 5.6%, one of its biggest selloffs in percentage terms since the 6.4% drop on Apr. 24, when Facebook (NASDAQ:FB) launched a rival service for free video calls for up to 50 participants.
It was also the biggest drop in dollar terms since Mar. 24, when President Donald Trump suggested he would call for lockdown restrictions to lift. Zoom was a technological light in the lockdown darkness, but it dimmed with the prospect of reopening of the doors of the massive US economy.
That’s why yesterday’s selloff seems so out of place, as the resurgence in cases of COVID-19 across the United States prompts tightening social distancing guidelines and putting the possibility of renewed lockdowns back on the table. The prospect of more people remaining at home should only increase the value of the access to others that Zoom provides.
One guess is that after being one of the best-performing stocks this year, it was the heaviest asset in investors' portfolios that they threw overboard, as a brewing storm shook the financial ship. So far this year, Zoom shares have risen by nearly 300%, compared with a 16% gain in the broader NASDAQ Composite.
Mad Money’s Jim Cramer considers this reversal a buying opportunity. Addressing long-term holders, he councils to start small, because yesterday’s selloff is likely to be contagious, triggering more selloffs today.
We agree, and we have the chart to prove it.

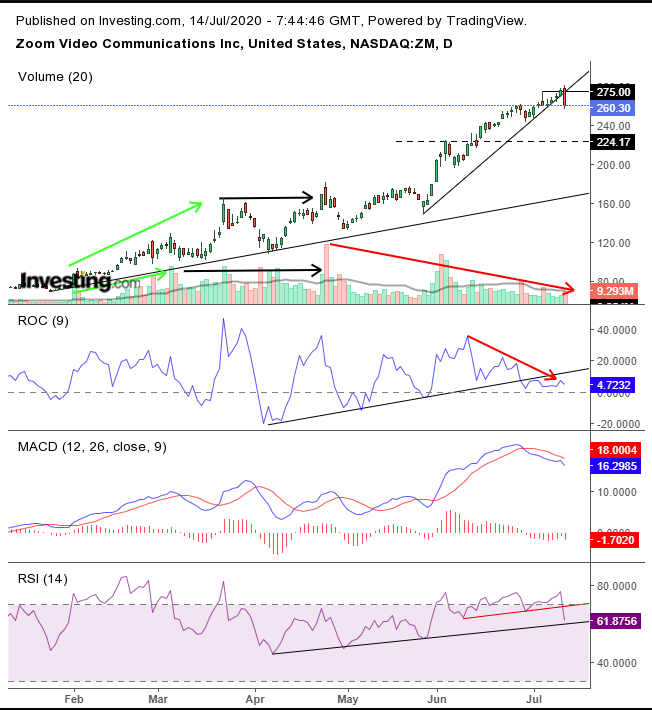
Monday’s selloff pushed the price below the uptrend line in place since the May 27 hammer low, confirming the resistance of the shooting star produced on June 6.
Yesterday’s candle developed a powerful bearish engulfing pattern that enveloped over 7 trading days.
Note how the volume, which was supporting the price from Feb. 3 to Mar. 5, went flat until Apr. 8, and, from that point, steadily declined. The volume echoed the direction in price until June, but then diverged when the shares spiked up from the May 27 hammer. That decline in volume showed the jump in the price was the work of fewer and fewer traders. When demand dries up, and all that remains is supply, the price falls.
The MACD’s short MA fell below the long MA, as prices weakened.
The ROC shows momentum is moving inversely to the price. Volume is falling below the uptrend line that matches the uptrend line in the price that has run since January, which has a target of $180, based its current angle.
Meanwhile, RSI, a less-sensitive momentum indicator, has yet to fall below its uptrend line and has topped out.
All in all, while we believe in the stock’s value in the long-run, because we foresee tighter economic restrictions due to COVID-19, we still expect a corrective dip due to profit-taking. In addition, any progress in managing the spread of coronavirus may weigh on the price as well.
Trading Strategies
Conservative traders should wait for a pullback to find support perhaps at the $180 level.
Moderate traders may begin accumulating at the $200 level.
Aggressive traders might risk a short position, counting on momentum, provided they understand the risk of swimming against the current.
Trade Sample – Aggressive Short
- Entry: $272—upon a rally to retest a powerful bearish pattern engulfing pattern
- Stop-Loss: $282—above yesterday’s high
- Risk: $10
- Target: $222—June highs
- Reward: $50
- Risk-Reward Ratio: 1:5
Note: This is a trade sample, not gospel. It is designed to simply demonstrate the pertinent parameters of a coherent trade plan. It is not the substance of the article. Feel free to change these parameters to suit your budget, timing and temperament—provided you understand all the moving parts and are willing, and able, to assume the risk.
