By Pinchas Cohen
On July 10, we suggested a short for the USD/CAD pair. Indeed, the Canadian dollar turned out to be the strongest among the majors for the month of July. Why?
Canada’s economy expanded 0.6 percent in May, three times the 0.2 percent expectation. Traders bought the loonie on the bet of another rate hike after the Bank of Canada raised rates earlier this month for the first time in seven years.
Bets by traders on an October hike rose from 67.2 to 73.6 percent, while markets see a 37.7 percent chance for a September hike when the Bank of Canada next meets.
Two Reasons To Be Bearish The Loonie
The stronger Canadian currency is hurting exports and this, combined with weak inflation, may spur the BoC into raising rates later rather than sooner.
Technical Perspective
From a technical standpoint, the more an asset moves, the more likely it will be to turn around for a correction, and you don’t want to be there when it does.
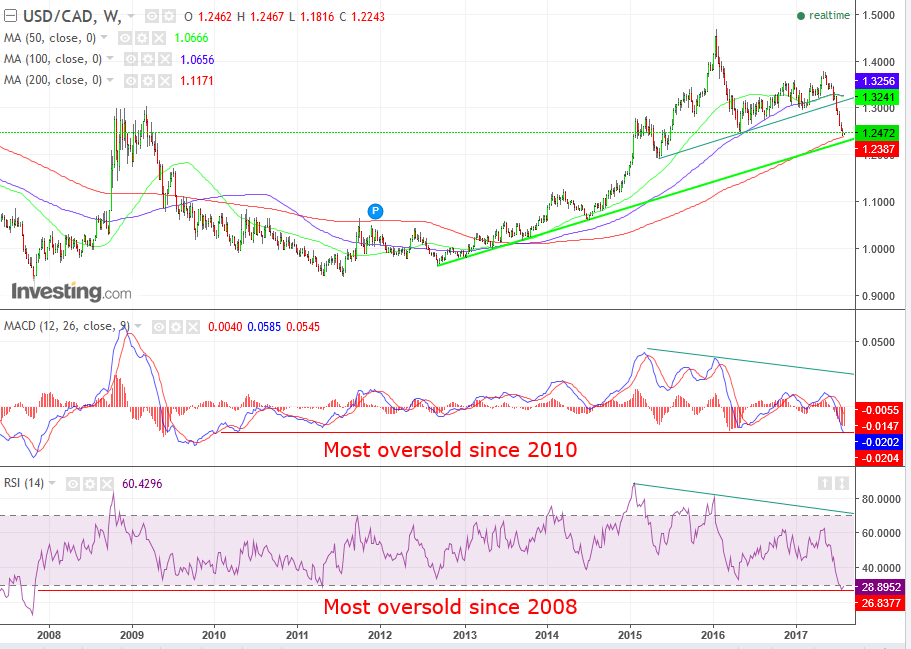
In our previous post, we plotted a H&S on the weekly chart. While only roughly half of its reversal implication has been achieved, there are an influx of indicators pointing toward a further decline.

The price just so happened to stop right above the 200-week moving average (red), which just so happened to be right on top of an uptrend line since September 2012.
Note that both the MACD and the RSI provided a negative divergence to the price, as they both have been trending down, while the price has been trending up. These indicators gave traders with an eye on the bigger picture a heads up for last month’s decline.
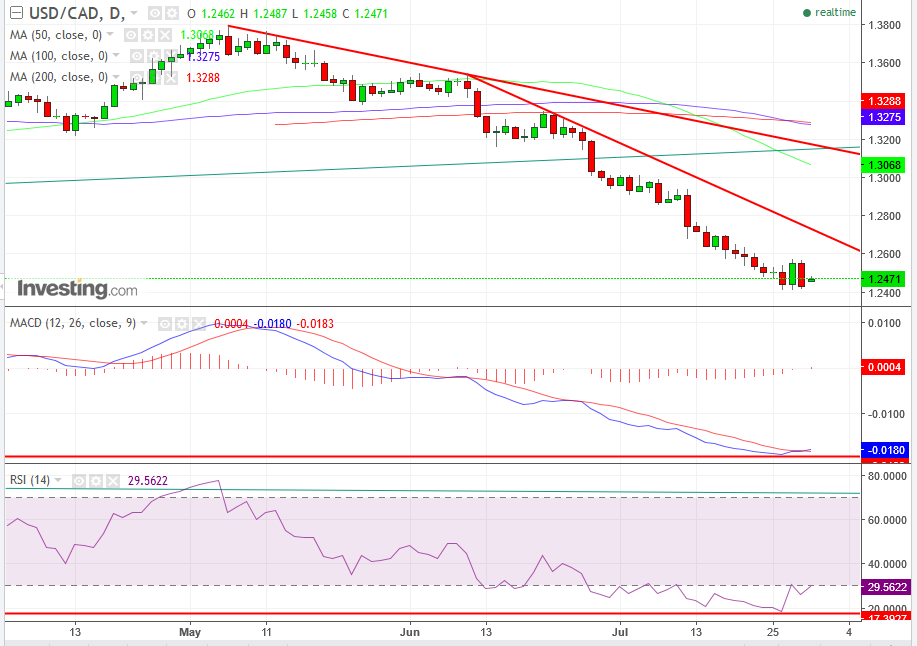
However, the 4.25-percent decline pushed the MACD’s fast moving average to reach the most oversold level since 2010, and the RSI reached the most oversold level since 2008, on the weekly chart, while it’s even more oversold on the daily chart (below). The MACD is the most oversold since 2009 and the RSI is the most oversold since 2007.

A sign of a turnabout, finally, may be last Thursday’s Bullish Engulfing pattern, the first one since June 20. On Friday, the pair declined again but remained above the support of the pattern. This kind of decline only strengthens the bullish sentiment among traders, as the support is bolstered, emboldening traders to add to their positions and enticing newcomers to enter long positions. That, combined with both rising MACD and RSI from decade-long extreme levels, weighs on the bullish side of the scale.
Even if the multi-year uptrend line were to break on a Canadian economy growing faster than that of the US and a potential uptrend in the price of oil, a correction may take the pair up in a return-move, to test the H&S neckline, which at this angle, is at 1.32, though it’s likely that a correction would be stopped by the falling trending since May, at 1.3 at this angle.
Trading Strategies
The more conservative traders enter trades in which they can afford the bigger stop-losses, while the more aggressive traders enter even with a smaller buffer.
A classic mistake by novices or even experienced but emotional traders is cutting wins on fear of losing them, and running with losses to avoid materializing what they consider only a "paper loss". Don’t be the cliché. Run with your wins, and cut your losses.
Since prices trend, they are likely to move some distance. Also, only enter positions with a minimum risk-reward ratio of 3:1 in your favor. In this way, when the position is a bust, you can live to trade another day. And when you win, you can cover your previous losses, before you even think of profits.
Stop losses:
- 1.2412, last week’s lowest price
- 1.2387, 200 week moving average and
- 1.2275, uptrend line
Take Profit:
- 1.2500, psychological resistance
- 1.2600, steeper downtrend line since June 9
- 1.2850 (a correction of a third of the decline, the minimum considered correction), resistance by early month price congestions and
- 1.3000 (a correction of a half of the decline, the classic correction), key resistance and May’s downtrend line.
