There are four methodologies that can be used for market analysis: macroeconomic, quantitative, fundamental, and technical. Each is a different approach to solving the same problem: weighing evidence in an effort to arrive at a statistical prediction for an asset's performance.
All four are valid and bring value to the market’s analytical table. Below, we'll use technical and fundamental analysis to get some perspective on what's moving the UK's pound sterling and where it's headed.
While the pound is expected to outperform the euro, because the BoE is not expected to fight rising yields on the country's government bonds—as opposed to the ECB which last week announced it was increasing emergency bond purchases “significantly” to curb rising yields—the UK currency may underperform versus the dollar, as Gilts have been sold off much more than Treasuries.

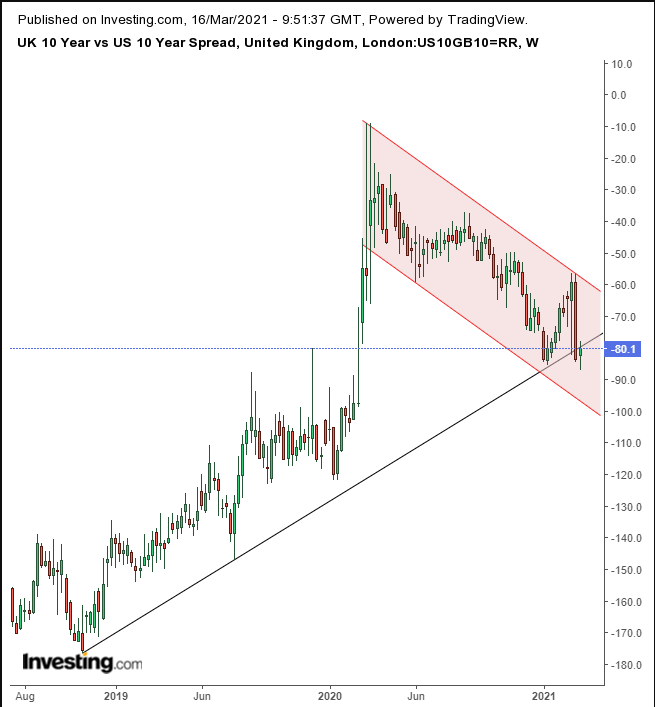
The 10-year, UK-US spread fell last week, below the uptrend line since November 2018. This week the spread has struggled in vain to climb back above it.
Note the upper shadow in this week’s candle. It penetrated the uptrend line, but the real body remains below, the picture of resistance. If UK vs US bonds were to resume their downtrend within the falling channel, we can expect the pound to follow suit verus the dollar.
As such, we find ourselves in a bind, since we have not changed our long-term, bullish view for the pound, though we only recently turned bullish on the dollar—after being bearish on the global reserve currency for many months.
Given that these are complex trades, however, with many variables that can influence each of the two currencies, we will maintain our course in a long-term uptrend for the pound, until we see any evidence that the supply-demand balance has shifted.

Still, we expect that the respective bonds will be a catalyst for a technical correction for the pound, a return move, after an upside breakout that completed a massive H&S, as can be seen in the link above. This will occur before the pound resumes its move higher, to both achieve the H&S implied target, as well as to complete another, even larger, double-top, which can also be seen in the chart at the top.
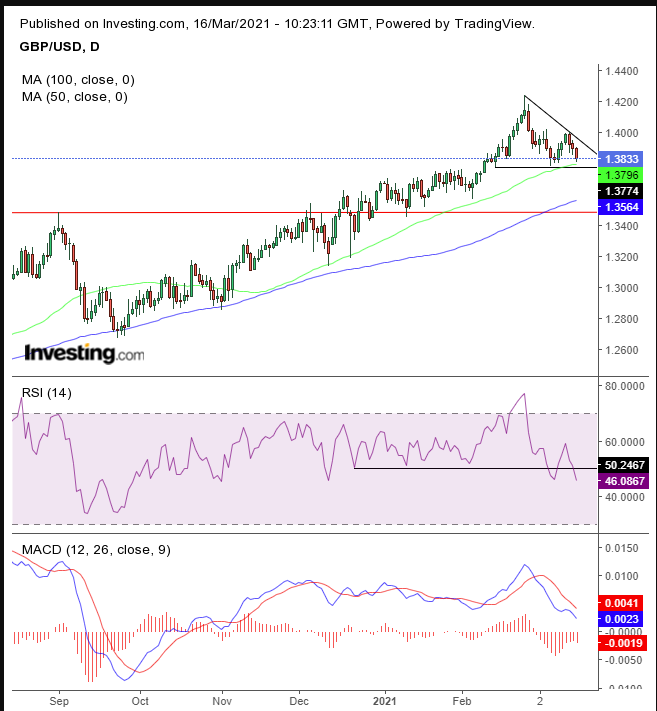
The GBP/USD is trading within a descending triangle, in which sellers are consistently gaining on buyers, who have been standing still. Once available supply drowns out what demand there is at the pattern bottom, sellers would be forced to continue lowering their asking price, if they wish to continue selling.
That would set in motion a chain reaction of liquidated longs and triggered shorts, taking the price back to retest the H&S (red) neckline at the 1.35 level.
The natural uptrend lines of the 50 DMA and 100 DMA point at where the breaking points for the short-term trends might be. The 50 DMA reveals the technical pressure point at the bottom of the descending channel, while the 100 DMA points to the H&S neckline as important.
Both the RSI and the MACD have provided sell signals.
Trading Strategies
Conservative traders should avoid this trade, as it goes against the main trade.
Moderate traders could short after the downward penetration would include at least one long red candle, then wait for a return move to verify the triangle’s integrity.
Aggressive traders would short at will, provided they understand the pattern is not complete before a downside breakout and that the main trend is rising. They must accept the risk, and have a coherent trade plan in place, to which they are committed.
Here’s an example:
Trade Sample 1 – Within the Triangle
- Entry: 1.3900
- Stop-Loss: 1.4000
- Risk: 100 pips
- Target: 1.3600
- Reward: 300 pips
- Risk:Reward Ratio: 1:3
Trade Sample 2 – Upon Breakout
- Entry: 1.3725
- Stop-Loss: 1.3800
- Risk: 75 pips
- Target: 1.3500
- Reward: 225 pips
- Risk:Reward Ratio: 1:3
Author's Note: This is a forecast, based on statistics, not knowledge of the future. Even if the analysis is correct, the samples provided do not guarantee positive results. Your budget, timing and temperament will impact your personal success. Therefore, it’s imperative to develop the skill of sound money management, without which the best analysis in the world won’t make you a successful trader. Until you develop that skill, take small risks, for the purpose of learning, not in order to make big money, because you will only lose.
