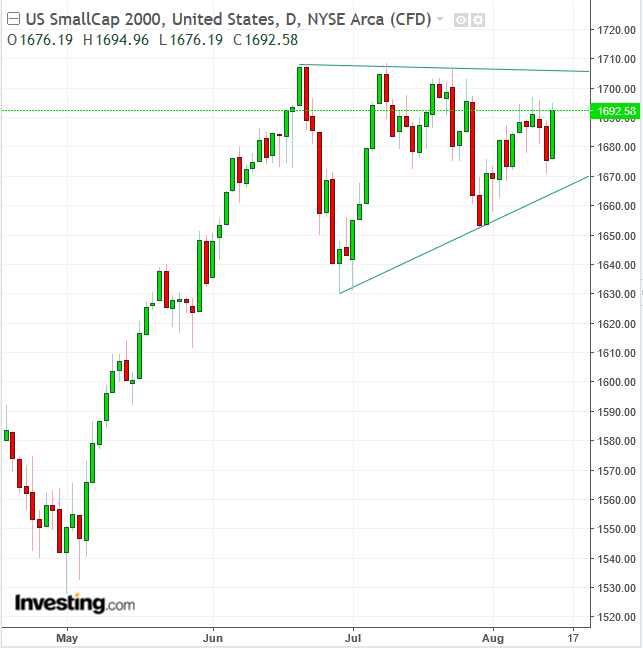
Several fundamental factors have recently benefited small cap stocks, providing them an edge over their larger cap counterparts. As such, demand on the Russell 2000 has been outpacing supply—a trend that is set to continue for the foreseeable future.
According to S&P Dow Jones Indices data, small caps are outperforming large caps by the most in eight years. According to a note posted last month by the firm's managing director and head of US equities, Jodie Gunzberg:
In the past four months, the smaller companies have outperformed larger companies by 10.1%, contributing to the fifth biggest realized small-cap premium in the first half of any year in history.
Investors are flocking to small cap shares for the same reason they are buying into the US dollar: as a shield against global geopolitical headwinds.
More specifically, shares of domestic US companies offer a significant advantage during a trade war: they don't rely on exports for growth. And while a stronger dollar hurts overseas sales, it doesn't impact local demand. Moreover, regional firms benefit from lower raw material costs, as imports become cheaper in proportion to the greenback's stronger buying power. Small firms are also benefiting more than large companies from tax cuts and deregulation plans recently set out by the Trump administration, given their revenues come almost entirely from the domestic market.
Finally, tax cuts have incentivized larger corporates to repatriate capital and invest in domestic firms via M&A, thereby boosting the stock price of smaller target companies. Will these favorable circumstances continue to prop up the performance of small cap companies?

The price of the benchmark Russell 2000 has been forming an ascending triangle, as demand has been consistently absorbing the available supply within the pattern. An upside breakout, above the 1,700 mark would demonstrate that buyers are set to up the ante in finding willing sellers at higher prices, triggering a technical domino effect, including triggered short stop-losses, long entries and positive sentiment, creating tailwinds for the index.
Trading Strategies
Conservative traders would wait for a 3-percent penetration of the pattern top, to filter out a bull trap. Then they might wait for a return move to confirm the uptrend, with at least one long, green candle engulfing a preceding red or small candle of any size.
Moderate traders might be content with a 2-percent filter. They may then wait for a return move, for a better entry, but not necessarily for confirmation of the pattern’s integrity.
Aggressive traders would move on just a 1-percent upside breakout, providing they can afford a stop-loss to below the pattern top or their equity management allows the risk of the potential loss.
Trade Sample
Applicable to all risk levels, as risk is graded by the price confirmation before exposure, not by the level of exposure itself:
- Entry: 1,710
- Stop-loss: 1,700 - round, psychological number
- Risk: 10 points
- Target: 1,785, based on the pattern's height
- Reward: 85
- Risk-Reward Ratio: 1:8
