Get 40% Off
⚠ Earnings Alert! Which stocks are poised to surge?
See the stocks on our ProPicks radar. These strategies gained 19.7% year-to-date.
Unlock full list

Chart of the Day: Yen Set To Strengthen Despite Japan's Economic Contraction

Published 05/15/2019, 10:01 AM
Updated 09/02/2020, 02:05 AM

Despite Japan’s economy worsening for the first time in six years, the yen is strengthening. The Cabinet Office’s coincident index of business conditions fell 0.9 point in April from March to 99.6, falling below the 100 base. This is the key composite index of economic indicators, and it’s reinforcing the view that the country’s economy has entered a recession.

The timing couldn’t be worse, as the downbeat figures come ahead of a 2% consumption tax hike to 10% in October, which is likely to hit consumer spending and thereby further slow the economy.

With a barrage of headwinds, investors are buying the yen for its safe-haven status, putting aside the outlook for the Japanese economy.

China’s economy is losing steam even ahead of the escalation of trade risk, Europe’s struggles to remain out of a contraction, and the uncertainty of the path to tightening of U.S. interest rates. All together, this makes for a very hazy macro outlook—not to mention other risks stemming from Brexit, Iran and North Korea.
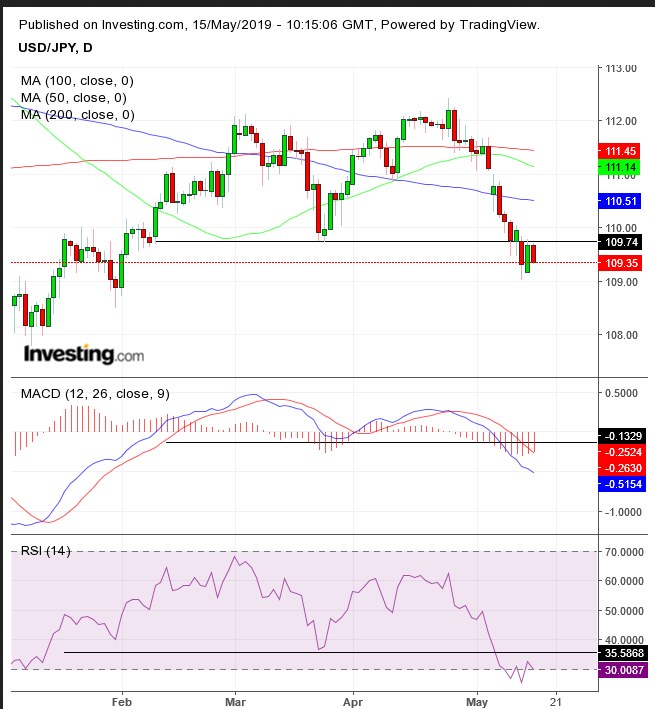
JPY Daily Chart

The USD/JPY pair completed a double top on Monday, when the price fell below the March 22 low. The price’s inability to maintain the rally past the early March highs was the first sign that something is wrong with the uptrend. Then, the price fell below the major MAs, till it finally fell below the March lows, completing the pattern.

The MACD and RSI completed similar patterns, and the 200 DMA sent the 50 DMA packing when it tried to scale higher to trigger a golden cross. Finally, today, the pair found resistance by the neckline below 110.00. All in all, it enhances the case for a dollar-yen reversal.

Trading Strategies

Conservative traders should wait for a deeper penetration into downtrend territory, testing the 108.49, Jan. 31 trough. Then, they’d hold on for a potential return move to retest the integrity of the pattern, with at least one long, red candle engulfing a green or small candle of any color.

Moderate traders may wait for the deeper breakout as well as for the expected pullback toward the neckline, but not necessarily for proof of a reversal; rather for an entry closer to resistance, to limit exposure.

Aggressive traders may short now, provided they understand and accept the risk, managed with a comprehensive trade plan that fits their equity.

Trade Sample

Entry: 109.50

Stop-Loss: 110.00

Risk: 50 pips

Target: 108

Reward: 150 pips

Risk-Reward Ratio: 1:3

Latest comments

i'm going to disagree with you. nobody is excited about sitting on a yen long due to the interest rate differential. the fed is still opposed to easing and the trade mess with china is likely to be resolved soon. i think the risk is to the upside for usd/jpy.
Chris, thanks for the comment. You're giving me a fundamental argument, but the column is Chart of the Day. Still, check out this post from December,about this very conflict, when the yen was 3.5% weaker and when consensus was for further US hikes https://www.investing.com/analysis/chart-of-the-day-200275007.
Risk Disclosure: Trading in financial instruments and/or cryptocurrencies involves high risks including the risk of losing some, or all, of your investment amount, and may not be suitable for all investors. Prices of cryptocurrencies are extremely volatile and may be affected by external factors such as financial, regulatory or political events. Trading on margin increases the financial risks.
Before deciding to trade in financial instrument or cryptocurrencies you should be fully informed of the risks and costs associated with trading the financial markets, carefully consider your investment objectives, level of experience, and risk appetite, and seek professional advice where needed.
Fusion Media would like to remind you that the data contained in this website is not necessarily real-time nor accurate. The data and prices on the website are not necessarily provided by any market or exchange, but may be provided by market makers, and so prices may not be accurate and may differ from the actual price at any given market, meaning prices are indicative and not appropriate for trading purposes. Fusion Media and any provider of the data contained in this website will not accept liability for any loss or damage as a result of your trading, or your reliance on the information contained within this website.
It is prohibited to use, store, reproduce, display, modify, transmit or distribute the data contained in this website without the explicit prior written permission of Fusion Media and/or the data provider. All intellectual property rights are reserved by the providers and/or the exchange providing the data contained in this website.
Fusion Media may be compensated by the advertisers that appear on the website, based on your interaction with the advertisements or advertisers.
© 2007-2024 - Fusion Media Limited. All Rights Reserved.