Get 40% Off
👀 👁 🧿 All eyes on Biogen, up +4,56% after posting earnings. Our AI picked it in March 2024.
Which stocks will surge next?
Unlock AI-picked Stocks

Chart Of The Day: S&P 500 Set For Wild Ride Up, Ahead Of The Next Fall

Published 03/17/2020, 10:47 AM
Updated 09/02/2020, 02:05 AM

These are perhaps the most uncertain times since WWII for the economy and the market. Because of coronavirus, the economy is screeching to a standstill as people are quarantined and  businesses close. 

The effect on markets has been dire: stocks and commodities have crashed, investors are rushing headlong into bonds causing yields to drop, and for many the future looks grim. Still, since markets don’t move in a straight line, savvy investors willing to take risks can still find profitable opportunities.

For those with the right temperament, the current conditions could enable the kind of profit that would normally take years to achieve, albeit in a very short amount of time. After correctly calling this selloff, we're seeing the chance for a solid, short-term long.

This morning, contracts on the S&P 500 index triggered the 5% limit-up, only to then erase all the gains. We think there's now a window in which to ride another potential bounce higher.

Why do we think prices will rise again? The chart tells the story, helping us forecast both rallies and declines.
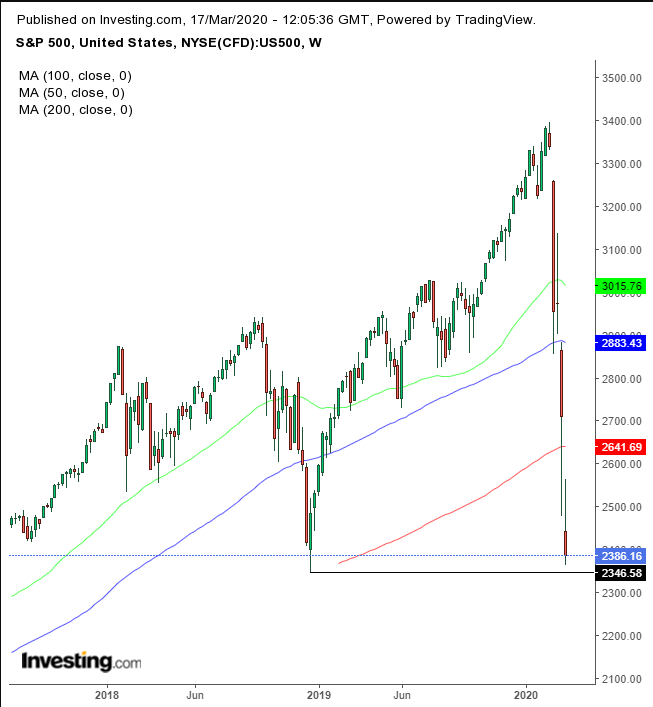
S&P 500 Weekly Chart

This virus-related rout has wiped out all of 2019's gains. An additional 2% drop would also erase the advance since 2017. This low between the two dates provides the ideal jumping-off point for a powerful rally that will most likely get many thinking that the massive global fiscal and monetary easing policies are doing the trick.

They would be wrong.

Still, the rally could be convincing. Meaning there's room to enjoy a wild ride up, so long as you get off ahead of the peak.
3rd party Ad. Not an offer or recommendation by Investing.com. See disclosure here or remove ads .

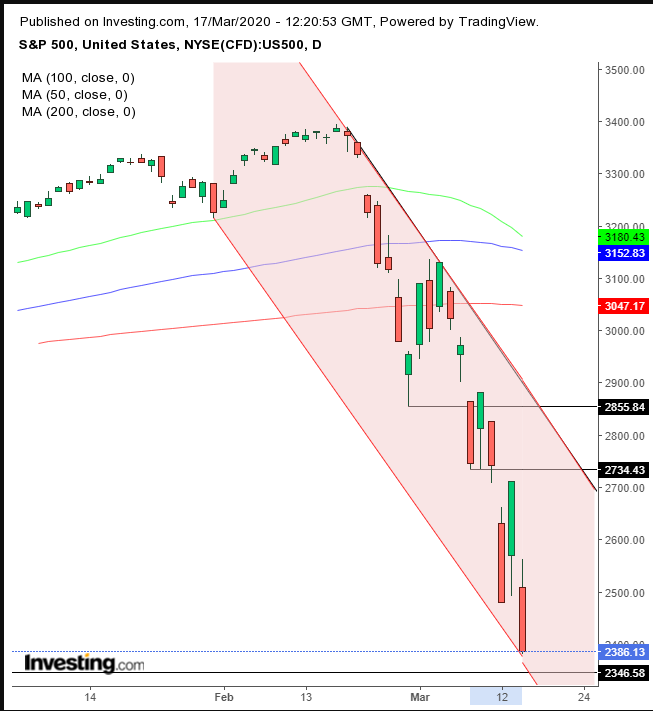
S&P 500 Daily Chart

The red, falling channel is a projection of where the S&P 500 is likely headed. It also provides upward targets. Nonetheless, it’s important to remember that this is a countertrend move, which make it risky, and that prices may never reach the top of the falling channel.  

Trading Strategies

Conservative traders do not trade against the trend.

Moderate traders may insist on waiting for consolidation before the rally, though that would be at the expense of the move.

Aggressive traders may risk a long position, with a stop-loss below yesterday’s low.

Trade Sample

  • Entry: 2,386
  • Stop-Loss: 2,286
  • Risk: 100 points
  • Target: 2,686
  • Reward: 300 points
  • Risk-Reward Ratio: 1:3

    Note: This is just a trade sample. It is only intended to emphasize the salient points of a coherent trade. It is not right for everyone, and not every trade wins.

Latest comments

It would be nice if the chart is posted to support the article
It is.
not in the app. still needs fixing
With Helicopter Money & if Trump wins we can go to 4000-5000 by 2020 ends! The biggest *******off rally is on its way!
Thanks a lot! ATH by May/June it seems possible.
You're welcome, Gravity, but I urge you to re-read the article and my previous posts. I don't think we'll see ALH for years.
ALH = ATH
thanks
moey$%11:00pm 3:30pm
thanks pinchas.....
You got it, Alberto
Risk Disclosure: Trading in financial instruments and/or cryptocurrencies involves high risks including the risk of losing some, or all, of your investment amount, and may not be suitable for all investors. Prices of cryptocurrencies are extremely volatile and may be affected by external factors such as financial, regulatory or political events. Trading on margin increases the financial risks.
Before deciding to trade in financial instrument or cryptocurrencies you should be fully informed of the risks and costs associated with trading the financial markets, carefully consider your investment objectives, level of experience, and risk appetite, and seek professional advice where needed.
Fusion Media would like to remind you that the data contained in this website is not necessarily real-time nor accurate. The data and prices on the website are not necessarily provided by any market or exchange, but may be provided by market makers, and so prices may not be accurate and may differ from the actual price at any given market, meaning prices are indicative and not appropriate for trading purposes. Fusion Media and any provider of the data contained in this website will not accept liability for any loss or damage as a result of your trading, or your reliance on the information contained within this website.
It is prohibited to use, store, reproduce, display, modify, transmit or distribute the data contained in this website without the explicit prior written permission of Fusion Media and/or the data provider. All intellectual property rights are reserved by the providers and/or the exchange providing the data contained in this website.
Fusion Media may be compensated by the advertisers that appear on the website, based on your interaction with the advertisements or advertisers.
© 2007-2024 - Fusion Media Limited. All Rights Reserved.