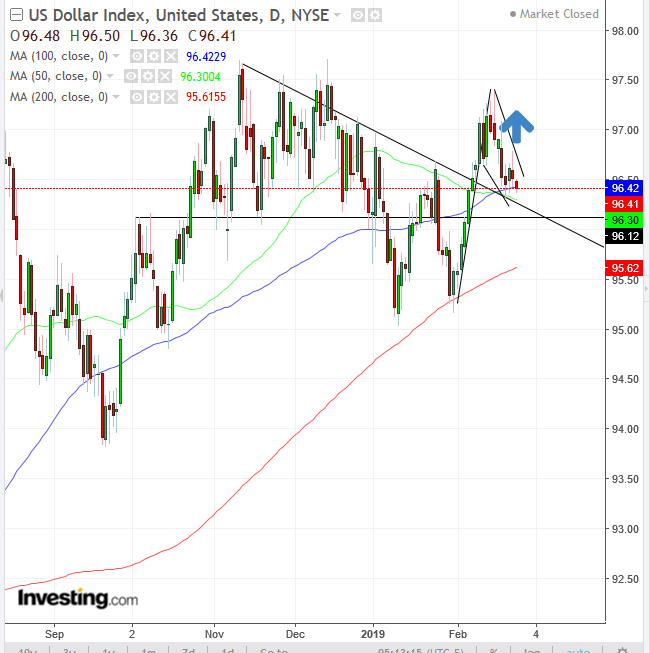
The U.S. dollar, after its strong mid-February run, is sliding. It's fallen on seven of the last eight days, and is now also being dragged down by Treasurys, as traders backpedal into growth on the back of a seemingly dovish Fed and progress in U.S. -China trade talks.
Is this the end of the double-digit rally since the February 2018 bottom? We don't think it is. In fact, we anticipate another rally that would test the November-December-February 97.50 levels.
The next leg up for the USD might come from any number of catalysts. For example, the market could be misreading the Fed. It could still step up and do what it set out to do in the first place, which was to continue to tighten policy irrespective of market action. Then, we have the U.S.-China trade-talk fallout and the ongoing trade war against Europe and Japan, as well as U.S. debt. And – of course – an equity bear market that would follow the longest bull market ever, now at a very mature stage of the business cycle, which would push global investors into U.S. Treasuries and the dollar.
On top of that, we have the technicals providing clear signals as to where the markets are going.

The eight-day straight advance earlier in the month, followed by the falling congestion is creating the typical bullish flag formation. While it may seem counter-intuitive that a decline, such as in a falling flag, would be bullish, that’s exactly what it is.
Furthermore, a down-sloping flag, in an uptrend, is more bullish than a congestion that is not declining. To understand why a drop might be viewed as bullish it helps to understand the market dynamics within a falling flag.
First, there's a rush into the instrument, propelling prices sharply higher, as happened in the eight-day straight climb mentioned above. Justifiably, traders who’ve been on the ride of their lives begin to second guess themselves and decide to take profits and breathe, while they try to calm their nerves and figure out where the market is headed next.
That profit-taking is what causes the price drop that develops the flag which follows the sharp move, the flag pole. The fact that prices don’t simply plunge after that surge but rather find support, suggests that there is enough demand to absorb the sudden supply. Presumably, this demand is by new bulls, who have been beating themselves up for missing the best rally in two years and were just waiting and praying for a dip.
If, in fact, the dollar breaks through the top of the flag, completing the pattern, several things happen, technically and psychologically. First, bears, caught on the wrong side of the trade rush to cover, creating a short squeeze, propelling prices higher still.
Second, the early bulls who got out realize now that there is more to go and jump back in, increasing demand. Finally, speculators who were on the sidelines join in for the fun.
Beware, however, that a flag breakout is often followed by a return move, in which the price retests the integrity of the pattern, before resuming with the trend. Note also that the demand of the flag coincides with the expected supports of the broken downtrend line since the top and the 50- and 100-DMAs, right above the previous double-top neckline.
This all adds to the weight of the evidence that there should be substantial demand at these levels to absorb all the supply and breakout topside of the flag.
Trading Strategies – Long Position Setup
Conservative traders would wait for the short-term uptrend to realign with the medium-term uptrend, by posting a new high, past the Dec. 14, 97.71 peak.
Moderate traders may go long with an upside breakout that closed at least above 96.78, Friday’s high price, at the top of the falling flag. Enter into your trade calculations the potential whipsaw that follows a breakout. Either wait for the price to retest the pattern or post your stop-loss far enough to include such volatility.
Aggressive traders might buy at will, though patient traders may wait for another potential dip – or at least for the price to retest the day’s low at 96.36 – or place their stop-loss according to the possibility of such a dip.
Trade Sample
- Entry: 96.35
- Stop-Loss: 96.25
- Risk: 10 pips
- Target: 97.35, the highest point of the flag, posted Feb. 15
- Reward: 100 pips
- Risk-Reward Ratio: 1:10
