US oil production has been falling, stockpiles have been declining for 8 weeks and demand for crude is growing as economic growth fuels prices. Additionally, the overwhelming bullish sentiment in equity markets since the start of the year is drawing a lot of buyers into crude oil future contracts.
Didn't Oil Already Bottom?
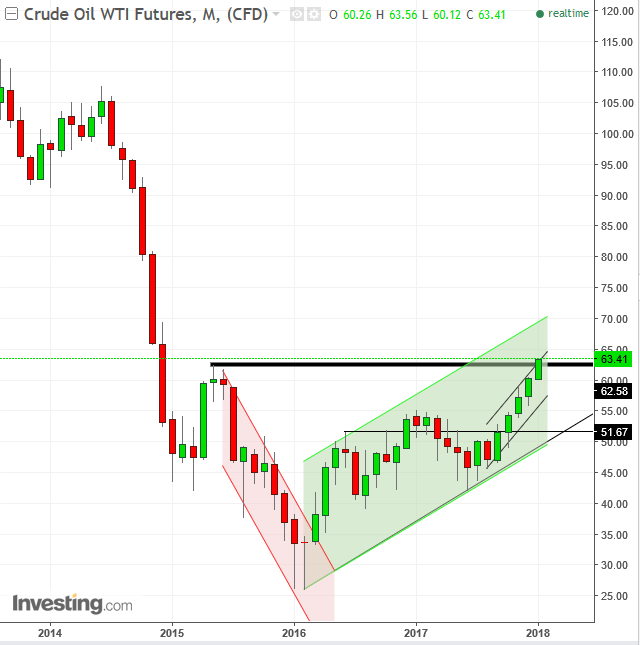
Many readers may be asking themselves: didn't oil reach a bottom a long time ago? The answer is yes, on February 2016, oil reached the bottom-low of $26.05, its lowest level since 2003. However, that didn’t necessarily mean that it hit bottom. The rise since then may have been nothing more than a corrective bounce within an ongoing downtrend. For those who can’t fathom prices lower than $26, consider that as recently as 1999, prices reached the $10 price level.

Strictly speaking, a bottom may have been called after the price registered a minimum of two successive, rising peaks and troughs. The second peak to complete that requirement was registered December 2016, when it scaled above the June 2016, $51.67 high price (thin black line).
However, a penetration of a falling peak in the 2014 crash (thick black line) demonstrates that demand is stronger than a potential supply of investors expecting the $36.50, 58 percent collapse that followed that peak.

Not only did the price penetrate the last falling peak of the 2014 crash, but it closed above it too, near the height of its session to boot. Moreover, when it did so, it broke through a rising channel-top since August 2017. All these technical signals paint a most bullish picture.
However, there is concern for a pullback, as reported in this Reuter’s article.
The EIA forecasts US oil out to reach 11 million barrels a day by the end of next year and break through the 10 million threshold this month, bringing it to levels similar to those of Saudi Arabia and Russia. Additionally, the rise in crude prices is eating away at refinery profits. In Singapore profits fell below $6 per barrel this week, its lowest level in five years. The less profitable refinery profits are, the less demand they provide for incremental crude in the near term.
Remember Hurricane Harvey, back in August? While there was an assumption that interruptions to supply would send prices sky high, in reality, prices fell and for precisely the same reason. However, the refineries were back online a lot sooner than anticipated, thus letting oil return to its rallies.
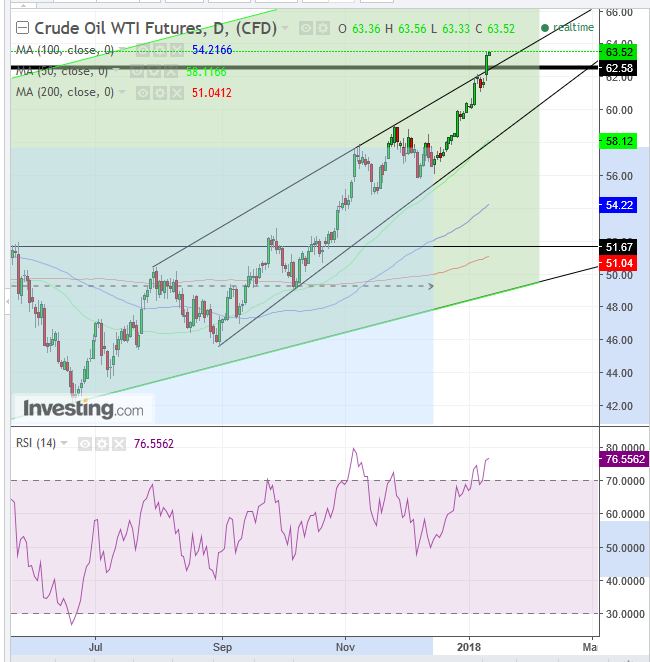
Technically, the price just jumped 13 percent since the December 14, $56.09 low, ripening it for a correction, as the volume of longs that want to cash out rises. The recent price rose much more sharply than usual, creating extremely wide gaps between price and moving averages, and moving averages among themselves. The wider the gaps, the higher the probability of an exaggerated price move. Like a rubber band, its elasticity has a limit and the harder you pull it, the harder it snaps back. The RSI has passed the generally accepted 70 overbought level, reaching higher than 76, which is the highest level since November 6, when it fell almost 5 percent after the RSI overbought signal, from the high of $57.61 to the low of $54.81. The current RSI read is lower than the November one, providing a negative divergence to the rising price.
The concern for a correction may become the hope of a buying dip.
Trading Strategies
Conservative traders may wait for a full correction (should it happen) to the long-term channel bottom, currently at $48.50, but rising every day. The 200 dma (red) is currently at $51 and rising. The 200 dma is considered a key indicator, as it provides a gauge for the yearly average. It may point the price level where the rising channel bottom may be when and if the correction gets there.
Moderate traders may wait for a return move to the steeper and smaller rising channel since August, at the $58 price level per the current angle and would likely cross the $60 key level by the time a potential correction would get there.
Aggressive traders may enter a short with a short stop-loss and then join the rest of the market after the correction.
