What could have prompted yesterday’s Amazon (NASDAQ:AMZN) selloff? The stock lost almost 2.4% during Monday trade.
Indeed, since its Apr. 29, blowout earnings report, which initially took the stock higher, shares have been slumping. The only negative fundamental news we could find that might have triggered this relates to scrutiny about the e-tail giant's non-payment of taxes in Luxembourg, despite posting record sales in Europe of €44 billion (almost US$53 billion). The reason: the company's Luxembourg unit reported a €1.2-billion loss (US$1.44 billion).
However, there's a critical caveat to this—the news item was published on Tuesday, so how is it that the Wall Street selloff occurred yesterday, ahead of publication? If this development did, in fact, have an impact on the stock, it could have been driven by “informed money,” people close to the decision makers, who may have gotten a whiff of the news before it became public knowledge.
Still, Apple (NASDAQ:AAPL) has had similar legal battles in Europe, and its stock has been doing pretty well notwithstanding. Even if the selloff was provoked by the Luxembourg investigation, the company and its shares aren't in any real danger.
If anything, the current move is likely an opportunity for profit-taking by some investors, which generally does not trigger a reversal. Plus, as we see it, it's a chance for people who missed our bullish call last week to get on board now. And buying the stock at this point provides an entry that's almost 5% cheaper than last week's all-time high.

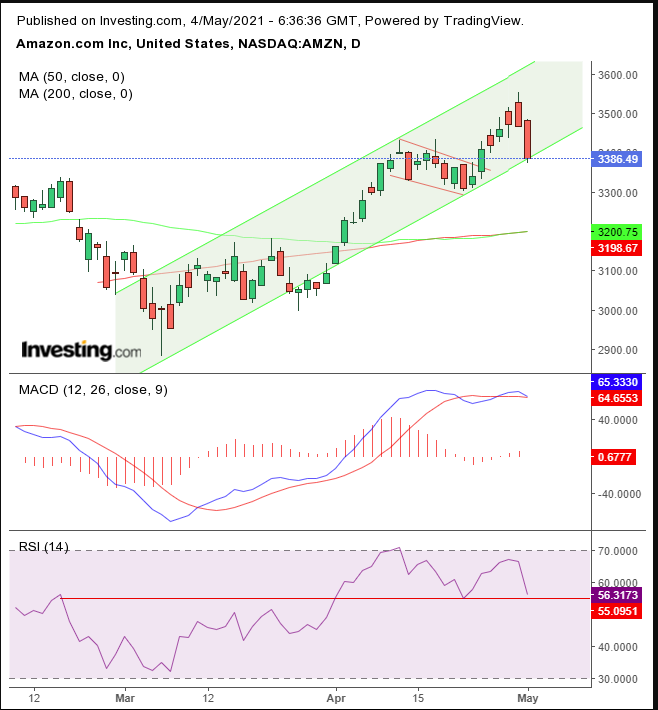
From a technical perspective, this selloff is the return-move that follows an upside breakout of a bullish flag. Note, that the 50 DMA, which briefly dipped below the 200 DMA, is now peaking back above it, despite the current selloff, demonstrating it hadn’t had an impact on the upward momentum.
To be sure, it’s coming close, as both the MACD and the RSI are resting at their support, just as the price is testing its rising channel at the same time that it tests the flag’s support. However, to understand why there would be such conflict at this level, and why the price is needed to develop a flag at this stage, look at the longer view.

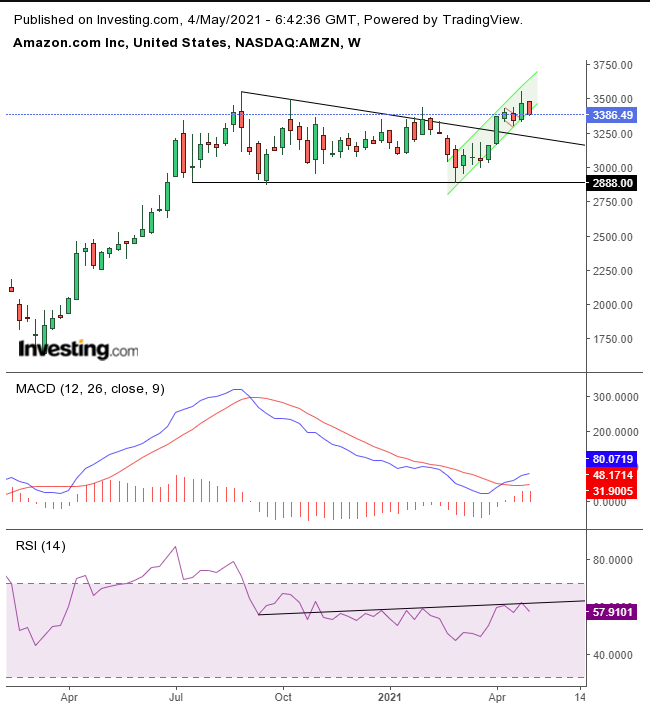
The flag, a market mechanism that creates momentum—as tired bulls take a breather while fresh bulls come in to carry the load higher—was necessary to reverse the long-term bias for a down move.
The stock has been developing a descending triangle since July 2020. However, instead of breaking to the downside, the price escaped through the roof, in the opposite direction of the presumption. The flag developed right after the pattern blowout, which gave bulls the added strength required to push against the market grain.
Observe that the weekly MACD reversed into a bullish position. The weekly RSI is still struggling against its resistance. However, if the RSI does climb above its resistance line, it will become the neckline of a momentum-based H&S bottom.
Trading Strategies – Long Position Setup
Conservative traders should wait for the price to bounce off the flag and make a new all-time high, then wait for the dip that comes after that.
Moderate traders would wait for the flag to demonstrate persistent demand.
Aggressive traders could enter at will, provided they accept the higher risk that is proportionate to the higher reward of moving before everyone else. At the end of the day, money management will determine success.
Here’s an example:
Trade Sample
- Entry: 3,380
- Stop-Loss: 3,350
- Risk: 30 points
- Target: 3,590
- Reward: 210 points
- Risk:Reward Ratio: 1:7
