Get 40% Off
🚨 Volatile Markets? Find Hidden Gems for Serious OutperformanceFind Stocks Now

Chart Of The Day: NASDAQ Braces For Correction After Record High

Published 07/08/2020, 10:35 AM
Updated 09/02/2020, 02:05 AM

As the NASDAQ Composite hovers near record highs, coronavirus cases in the US have topped 3 million. Dr Anthony Fauci, the country's top authority on infectious diseases, has warned against taking comfort in the "false narrative" of a declining death rate—going against the apparent optimism of President Donald Trump, a number of his top officials and some governors. Meanwhile, ICUs in 56 hospitals in Florida—which has seen record-breaking increases in the number of new cases—reached maximum capacity.

Cleveland Federal Reserve President Loretta Mester warned economic activity is slowing down in her area. Both the IMF and Goldman Sachs recently took an axe to their forecasts for US economic growth this year.

Some of the recent optimism in the financial markets was due to strong consumer spending, which accounts for about three-quarters of GDP. However, as unemployment benefits expire this month for more than 19 million Americans, we will start to see the data deteriorate.

Yesterday, the tech-heavy index scored a new all-time high, but had backed down by the end of trading.
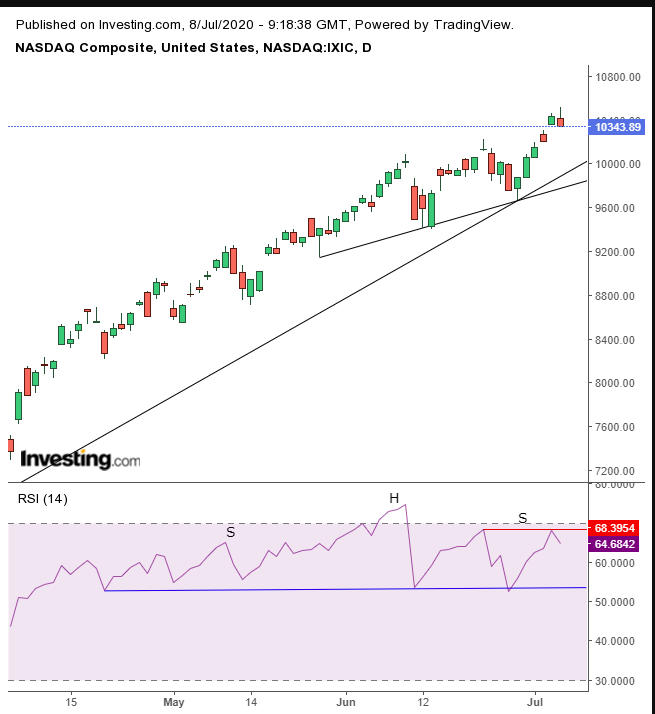
Daily NASDAQ Technical Chart

Right before someone dies in a horror film, there's usually a moment of optimism. He discovers an escape route. The audience gets their hopes up and then the serial killer gets the teenager. That may be what happened yesterday.

Bulls saw Monday’s show of force and felt confident of easy pickings. Only then, the tide turned and they ended the day hungry and licking their wounds. Tuesday's trading created a shooting star pattern, which can be summed up as reflecting false hope. Bulls gave it a go, but were pushed back and forced to retreat. The fact that it happened after a rising gap also sets the NASDAQ up for an Island Reversal.

3rd party Ad. Not an offer or recommendation by Investing.com. See disclosure here or remove ads .

To clarify, the index is still very much within an uptrend. However, the earlier congestion has shown for over a month that the picture is not clear, which raises the chances of at least a corrective dip. The breakout that followed may have been premature, given that it was built on a streak of stronger-than-expected data. Some may have misinterpreted the numbers as being nothing more than a dead-cat bounce after the worse recession since the 1930s.

The RSI provided multiple negative divergences. First, its lows were flat and did not support the rising lows the price was marking. Second, it failed to return to its own recent record highs, having found resistance at the June 23 peak. Overall, the NASDAQ might be forming a H&S top, which suggests a price reversal that will follow momentum indicators lower.

Trading Strategies

Conservative traders would wait for a pullback to provide evidence of accumulation and rejoin the uptrend.

Moderate traders would go long on dips to maybe the 10,000 psychological level.

Aggressive traders might risk a short and ride the correction down.

Trade Sample – Aggressive Short

  • Entry: 10,420 – upon a rally
  • Stop-Loss: 10,520 – above all-time high
  • Risk: 100 points
  • Target – above psychological round number
  • Reward: 400 points
  • Risk-Reward Ratio 1:4

Latest comments

I came up with a very similar realization except i was looking at the monthly chart with rsi and noticed it made a double top above 70 right before the march crash, and today it is sitting at the same or even higher rsi.
I guess no selloff today Pinchy. Better luck tomorrow!! JA JA JA :-)
People shorting the market must feel like THEY have been in a horror movie for months
 LOL
don't see the h&s pattern mentioned, looks like it's just been rising since March. mostly on Fed buying 80 billion this month, ends on the 11th, I'd expect correction by Monday, with slow grind highest during earnings season.
The H&S mentioned refers to the RSI.
I'm happy holding SPXS and SQQQ since Monday...
You must enjoy losing money
fed is just starting, now they buy Microsoft and Apple bonds, we haven't seen anything yet. it will have dips along the way to 20k
what are you even referring to. When did the fed do that?
It would be good to dig into some data that shows who owns the stock markets. Then, we will have a clear picture of where the money is coming from.
lol
Nah
Nasdaq is going to double , 20k will go parabola before any dip or correction
Hello, I the time of posting this article NASDAQ was over 10520.
No, I am referring to the Nasdaq Composite, which opens 9:30 EDT. You must be confusing it with a futures contract. Also, the same is just a sample. It isn't a holy bible. It's only designed to provide you with the basic parameters necessary for a coherent trade plan, which you can write yourself, to suit your personal needs.
Have any comment about current NASDAQ developments. Would say that any shorting is fighting against FED. And you know who is winner it that fight. Of course small adjustments to lower is always possible, but is there any considerable space for reversal?
Risk Disclosure: Trading in financial instruments and/or cryptocurrencies involves high risks including the risk of losing some, or all, of your investment amount, and may not be suitable for all investors. Prices of cryptocurrencies are extremely volatile and may be affected by external factors such as financial, regulatory or political events. Trading on margin increases the financial risks.
Before deciding to trade in financial instrument or cryptocurrencies you should be fully informed of the risks and costs associated with trading the financial markets, carefully consider your investment objectives, level of experience, and risk appetite, and seek professional advice where needed.
Fusion Media would like to remind you that the data contained in this website is not necessarily real-time nor accurate. The data and prices on the website are not necessarily provided by any market or exchange, but may be provided by market makers, and so prices may not be accurate and may differ from the actual price at any given market, meaning prices are indicative and not appropriate for trading purposes. Fusion Media and any provider of the data contained in this website will not accept liability for any loss or damage as a result of your trading, or your reliance on the information contained within this website.
It is prohibited to use, store, reproduce, display, modify, transmit or distribute the data contained in this website without the explicit prior written permission of Fusion Media and/or the data provider. All intellectual property rights are reserved by the providers and/or the exchange providing the data contained in this website.
Fusion Media may be compensated by the advertisers that appear on the website, based on your interaction with the advertisements or advertisers.
© 2007-2024 - Fusion Media Limited. All Rights Reserved.