Get 40% Off
🚨 Volatile Markets? Find Hidden Gems for Serious OutperformanceFind Stocks Now

Chart Of The Day: Technicals Confirm S&P 500 Is Now In A Downtrend

Published 10/01/2020, 09:42 AM
Updated 09/02/2020, 02:05 AM

As September came to a close, the S&P 500 Index locked in a 4.7% loss for the month, its worst decline for the same period since 2015, when the index shed 5.1% of value. However, when the benchmark fell to its 3,209.45 low—exactly one week ago—it was down as much as 8.3%, on track then to provide the worst results since the 8.6% losses on September 2011.

An abrupt realization by investors that mega cap tech stocks were overvalued, triggering a comparison to the dotcom bubble, sent high-flying tech shares lower, weighing on the broader index. However, the very same technology companies that dragged benchmarks into a rout were suddenly bargains at their lower levels, which seemed to justify driving prices up again. Adding to the market pressure, on-again, off-again hopes of additional US pandemic economic relief, chances of which today appear once again optimistic.

However, while the S&P 500 did climb for the fourth day out of five yesterday, the widely-followed benchmark did close well off its high after Mnuchin said there had not yet been a final agreement hammered out.

Trader consensus, however, isn't projecting optimism this deal will actually come to fruition. Technicals projected by the price and its trading pattern indicate the index is heading lower.
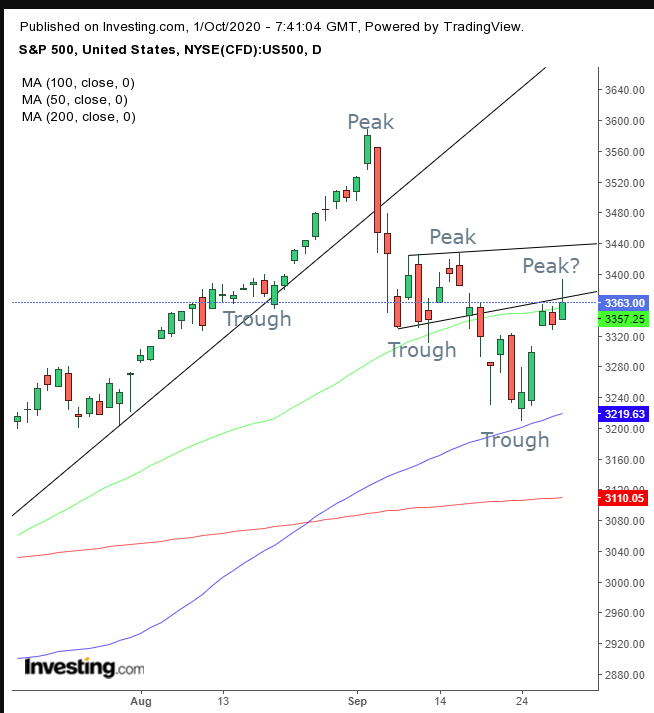
SPX Daily

As mentioned above, yesterday’s advance finished well off intraday highs. It did so after attempting to breach a rising flag, bearish after the 7% plunge in just three sessions from Sept. 3-8. Yesterday was the third day in which the price fell away from the bottom of this bearish pattern.

3rd party Ad. Not an offer or recommendation by Investing.com. See disclosure here or remove ads .

The 50 DMA joining the flag’s bottom underscores it's a technical pressure-point, where supply and demand meet. Wednesday’s trading pattern developed a shooting star, a candlestick with a long upper shadow, charting how bears drove bulls back, a bearish indicator.

Combined, all this increases the odds that the current rally is losing momentum. Market mechanics—a return move following a breakout, after the first explosive drop, as demand dried out within the continuation pattern—let supply crash when sellers raced to find new willing buyers, at lower prices. The return-move was presumably fueled by a short, along with short-term dip buyers, compounded by hopeful bulls.

Now that the move's technicals have been cleared out, the resistance on the very bottom of the flag suggests positions will continue to roll along the market dynamics, perhaps prematurely pricing-in the ever illusive stimulus package.

Trading Strategies – Short Position

Conservative traders would wait on a short, for another trough, establishing a downward peak-trough formation, independent of the prior uptrend.

Moderate traders may risk a short with a close below the present week's price cluster, which would indicate that demand has run out, letting supply crash lower.

Aggressive traders would short right now, after bulls failed yesterday to take on the flag, even after piercing it on an intraday basis, sending them into a retreat, providing they have a trading plan that they will follow. Here’s an example:

Trade Sample

  • Entry: 3,365
  • Stop-Loss: 3,400
  • Risk: 35 points
  • Target: 3,225
  • Reward: 140
  • Risk:Reward Ratio: 1:4
3rd party Ad. Not an offer or recommendation by Investing.com. See disclosure here or remove ads .

Latest comments

Agreed. You can also draw a channel with support on bottoms. It looks like bullish flag, but I think that there is one leg down. There was no LH or double bottom to help SP to break up. Target around previous LL is reasonable
looks like another lower high. would need a big move up to reverse the daily downtrend. Bearish
Well, Eric, a lower high by definition needs a lower low. As of now, the price could still go higher. So, there is no lower high yet.
apologise , its Cohen, a good name
I don't mind if you spell it "Cohan," I only made the comment to Mikko Saarela to be annoying by completely missing his point.
thanks for the comment Cohan, its the stimulus 'hopes', it tested the 50% fib and the 200 4H ema confluence (also), its a 'third test', hence may break up more easily now.
Sure thing, Jan. Indeed, hopes, but as we've learned since the Mar bottom, hopes can drive markets for a while too, substantiated or not. I'm sorry but I only rely upon analytical methods I understand, and since I don't understand Fib, I don't rely on it.
S&P not in downtrend! Below 3216 maybe
It's in a short term downtrend after establishing two lower peaks and troughs, as I've marked on the chart. I don't understand why you attach significance to 3216.
Your flag is very subjective, alternatively; Sp has daily close inside a box, and now can trend higher, although of course its hard to imagine any retest of all time high, fibs more reliable for a short upon certain price action
Agreed. However, I drew the flag before yesterday's price action. You can see it in yesterday's post. The close below the flag bottom lends credence to my interpretation. While subjective, I didn't draw my flag willy nilly arbitrarily, but based on my experience. Monday's and Tuesday's resistance and the 50 DMA reveal where the technical pressure point is, and that is the whole point of the flag. Anyway, right now, it looks like it could be a blowout, as the price retests yesterday's shooting star on an intraday basis.
Cohan has no idea what he is talking about
It's Cohen.
mikko, let's hear your analysis.
Risk Disclosure: Trading in financial instruments and/or cryptocurrencies involves high risks including the risk of losing some, or all, of your investment amount, and may not be suitable for all investors. Prices of cryptocurrencies are extremely volatile and may be affected by external factors such as financial, regulatory or political events. Trading on margin increases the financial risks.
Before deciding to trade in financial instrument or cryptocurrencies you should be fully informed of the risks and costs associated with trading the financial markets, carefully consider your investment objectives, level of experience, and risk appetite, and seek professional advice where needed.
Fusion Media would like to remind you that the data contained in this website is not necessarily real-time nor accurate. The data and prices on the website are not necessarily provided by any market or exchange, but may be provided by market makers, and so prices may not be accurate and may differ from the actual price at any given market, meaning prices are indicative and not appropriate for trading purposes. Fusion Media and any provider of the data contained in this website will not accept liability for any loss or damage as a result of your trading, or your reliance on the information contained within this website.
It is prohibited to use, store, reproduce, display, modify, transmit or distribute the data contained in this website without the explicit prior written permission of Fusion Media and/or the data provider. All intellectual property rights are reserved by the providers and/or the exchange providing the data contained in this website.
Fusion Media may be compensated by the advertisers that appear on the website, based on your interaction with the advertisements or advertisers.
© 2007-2024 - Fusion Media Limited. All Rights Reserved.