After technology stocks were to blame for the worst equity market rout in seven months, investors are paying particular attention to one company's earnings report. All eyes are on Netflix (NASDAQ:NFLX), the first large technology company to deliver earnings this quarter, when it reports later today, after the market close.
Will Netflix lead the sector and the broader market into a rebound and challenge recent all-time-highs to maintain the uptrend? Or will it exacerbate already frayed nerves and provoke a steeper selloff?
Regarding the company itself, focus remains on whether Netflix will show growth in its subscriber numbers after last quarter’s miss in this key metric sent the stock plummeting. It dropped 2.4 percent within the first 10 minutes of trade after the report was released. Bloomberg forecasts that the tech giant will increase subscriptions by 5.1 million in the third quarter.
Another critical component for investors to watch: competition. Reports indicate that Apple (NASDAQ:AAPL) plans to spend $1 billion this year on developing original content as part of its effort to convert growth from hardware to software. Although this is barely a drop in the bucket compared to Netflix's $8 billion outlay on content this year, Netflix shouldn't underestimate Apple's ambition. Apple has already proven that it is not just an iPhone company—it is flush with cash, understands it must find new streams of revenue to keep growing, and is therefore a company to take very seriously.
If Netflix shows clear growth in today's report, are shares poised to push higher in the longer term? Not necessarily.

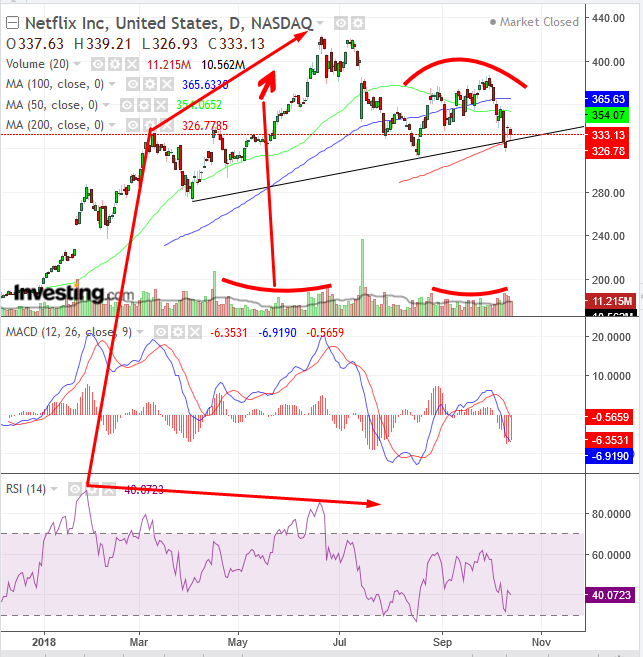
From a technical perspective, Netflix is on the verge of topping out of an H&S pattern. A critical confirming indicator for a bona fide H&S is volume. Notice how volume dries up when prices rise and increases when prices decline. That is a clear sign of distribution, a term used when large players sell on the rallies.
Regarding the trend, it has already formed two descending peaks from June to October and fell on Thursday to 1.5 percent above the August trough. A slip below $310 would establish a downtrend.
The RSI provided a negative divergence as momentum fell, when the price rose from the March low of under $334, and at the all-time high of $423, posted on June 21.
The MACD has already provided a sell signal.
The price, which found support yesterday by the uptrend line since April and the 200 DMA, is holding on by a thread, and the 50 DMA already crossed below the 100 DMA, showing where prices may be headed.

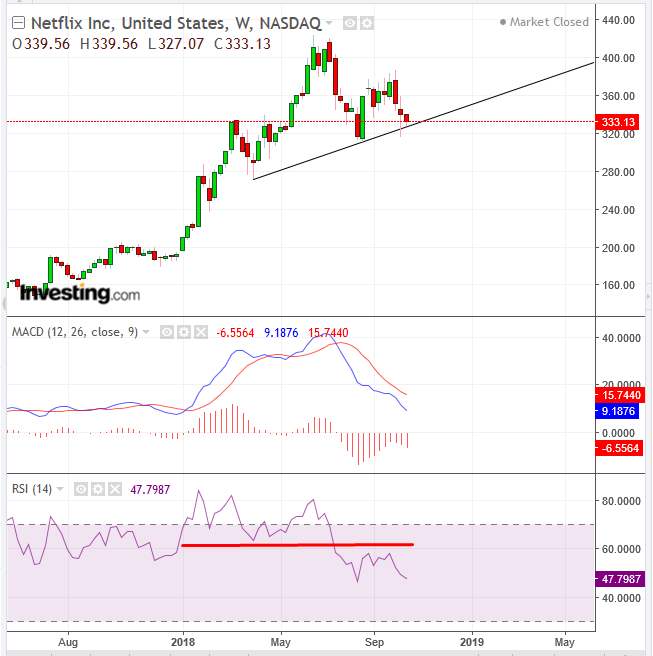
Also, on the weekly chart, the RSI provided a negative divergence, as it already topped out, perhaps ahead of the price. The MACD soon followed with a sell signal of its own, when its shorter MA crossed below its longer MA.
Trading Strategies– Short Position Setup
Conservative traders should wait for a decisive downside breakout, with at least a 3 percent penetration from the uptrend and the neckline of an H&S top, to avoid a bear trap. Then they would wait for the likely return move to retest the reversal pattern, before committing a position successfully.
Moderate traders would wait for at least a 2 percent penetration of the neckline. Then, they might wait for a return move, for a closer entry to the presumed resistance, thereby minimizing the position's risk, but not necessarily for confirming the pattern's integrity and thus the trade's risk.
Aggressive traders may risk a position with just a 1 percent penetration, that would include falling below the 200 DMA.
