This article was written exclusively for Investing.com
Caught between a rock and a hard place, gold has been unable to make a more meaningful comeback over the past couple of days and was holding in negative territory on the week, at the time of writing in the early hours of Friday. But as the metal continues to coil inside narrowing ranges, a big breakout could be on the cards soon.
The buck-denominated precious metal has not benefited much from the recent risk-off trade as investors reduced their exposure to the EUR/USD and stocks most sensitive to lockdown, such as the hospitality sector, after virus cases spiralled in Europe, causing the US dollar index to correspondingly rebound.
But heightened concerns over the economic impact of the resurgent virus cases in Europe and elsewhere means global interest rates will likely remain low for longer in order to support the recovery. As a result, we have already seen benchmark government bonds rally, causing yields on German bunds and US Treasuries to come under renewed pressure. When bond yields fall, this usually boosts the appeal of lower-yielding or non-interest-bearing assets, such as gold and silver.
Thus, the falls in yields have helped to offset the negative impact on gold arising from a rebound in the dollar index.
So, gold has been finely balanced, and some investors are undoubtedly waiting for some other macro stimulus to trigger a rally—or indeed a sell-off—in gold prices. But as concerns grow over the economic recovery, there may now be more urgency by governments to respond to the second wave of infections by providing fiscal stimulus.
Therefore, there is a chance we could finally see some breakthrough in negotiations over the EU recovery fund and the US stimulus package over the coming days. If so, this should not only be good news for stocks, but should be positive for precious metals too.
Indeed, stimulus is what has been driving both stocks and precious metals higher in recent years. Although the correlation between gold and the S&P may not bee too strong, they have had a positive relationship, nonetheless:
| 1 week | 1 month | 3 months | 6 months | 1 year |
US 2Y T-Note | -0.59 | -0.44 | 0.19 | 0.89 | 0.84 |
US 10Y T-Note | -0.34 | -0.17 | 0.31 | 0.67 | 0.83 |
EUR/USD | 0.90 | 0.94 | 0.79 | 0.93 | 0.78 |
-0.40 | -0.48 | -0.34 | -0.78 | -0.77 | |
Silver | 0.96 | 0.98 | 0.84 | 0.97 | 0.79 |
US SPX 500 | 0.26 | 0.34 | 0.31 | 0.86 | 0.39 |
Gold’s negative relationship with the dollar is hardly surprising when you look at the correlation coefficients of the EUR/USD and USD/JPY. But to underscore the above point about stimulus, notice how strong gold’s relationship is with bond prices over the longer periods of 6 months and 1 year.
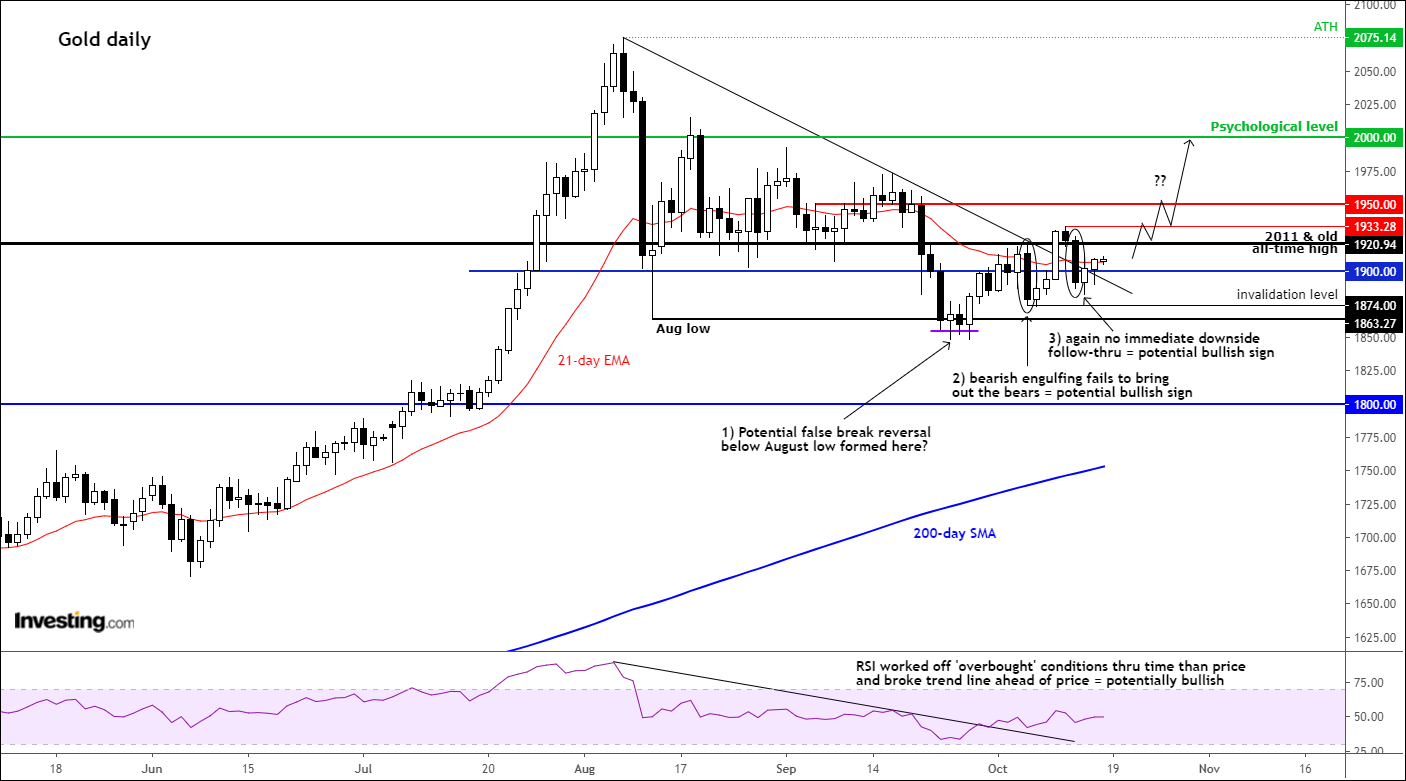
Meanwhile, gold is potentially coiling for a breakout from a technical perspective, following the recent consolidation:

The bullish, or potential bullish signs, I have observed include:
- A possible false break reversal (or fakeout) below the August low, something which I had been anticipating to happen to gold and indeed silver when both metals were selling off in September
- Refusal of the price to go down after the formation of bearish-looking price action: on the chart I have circled two big down days which failed to bring out the bears on the next day—this is suggesting the sellers are potentially getting trapped
- Break of bearish trendline—admittedly, it hasn’t been a clean break but now that the trend line has been taken out, there is one less thing for the bulls to worry about
- Relative Strength Index (RSI)—the popular momentum indicator has worked off its 'overbought' conditions mainly through time (i.e. consolidation) rather than price action (i.e. a big sell-off) and has broken its bearish trend line ahead of price
However, there has also been some bearish signs, including:
- Three clear lower highs have now been made since prices hit a record high in August
- Repeated failure to rise back above the old record high from 2011
- Bullish momentum has been lost over the past couple of months
Overall, however, price action has not been too bearish. Indeed, given the longer-term bull trend and a still-supportive fundamental backdrop, I expect gold to resume higher than to suffer a sizeable sell-off. What I would like to see next is a clean break above that old all-time high at $1920/1 area. If this condition is met then $1950 would be the next immediate target, followed by $2000 thereafter.
That being said, it is important to be prepared for the alternatives scenario in case I am reading price action completely wrong (especially given the recent sell-off in correlating markets such as the EUR/USD and AUD/USD et al.) With that in mind, I am prepared to admit I have got it wrong if gold were to break its most recent low, prior to the latest rally, at around $1874. If this level is breached, we could well see a sharp drop, possibly towards low $1800s.
