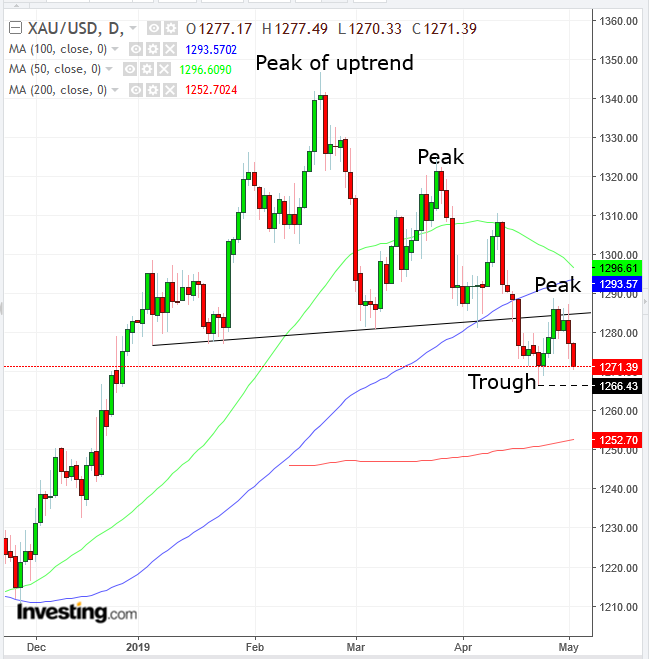
Gold has fallen to the lowest levels of the year, and we are set for an all-out medium-term reversal, ahead of tomorrow’s nonfarm payrolls.
We have been bullish on gold for a while, with our last trade call March 5, as it was falling for the fifth straight day, which we considered a buying dip, as the medium-term was still up. Sure enough, that very day saw it hammer out a bottom, which preceded a 3% rally.
Gold is now falling in unison with the dollar, emphasizing how scant the demand for the precious metal is in the current market environment. This correlation follows a similar tandem move that happened two weeks ago. The continuing dollar weakness is understandable within the context of Fed Chair Jerome Powell's dispelling any speculation for a rate cut, but why is gold falling, for the second day, as its currency base becomes cheaper?
The technicals may help explain what's likely to happen next, even if they can't answer all the questions around fundamental drivers.

Chart powered by TradingView
Gold completed an H&S top, when it crossed below its neckline, the line that connects the lows of a congestion since the beginning of the year. The neckline’s inability to support the price projects dissipating demand and a potentially crucial price level.
At the same time, it marks the crossroads of outlooks, triggering orders waiting around crucial support and resistance levels. The neckline’s significance is highlighted with the 100 DMA’s violation, especially as it plateaus, with the 50 DMA breathing down its neck.
The neckline was also tested – successfully, for now – as its prior support turned to resistance Monday when the price was unable to remain above the neckline to keep Friday’s advance.
Although the pattern was complete when closing below it, beware of a bear trap. The price penetration reached only as much as 1.32%, satisfying only an aggressive filter.
Furthermore, a stricter, more purist interpretation of peak-trough analysis doesn’t include a peak of the previous trend, demanding another trough to complete two peaks and troughs independent of the Feb. 20, $1,346.79 high, below the April 23, $$1,266.43 low. Finally, the 200 DMA is a potential support.
To summarize, a trough lower than $1,266.43 would satisfy a stricter chart-read in the medium-term downtrend, and gold will have no remaining support below $1,250 for another $90, till $1,160, where the price would retest the long-term uptrend line since November 2015.
Meanwhile, however, we consider the odds highly in favor of the pattern completion according to the satisfaction of every school of thought.
Trading Strategies
Conservative traders would wait for a fall below the 200 DMA, which would then prove itself as a resistance upon a pullback.
Moderate traders would wait for the completion of the stricter peak-trough interpretation.
Aggressive traders may short at will, after deciding on accepted risk. They might prefer to wait for the price to either retest the $1,285 neckline level or fall below the $1,266, April 23 trough, to reduce exposure by being closer to support-resistance levels.
Trade Sample
- Entry: $1,280, top-neckline on hourly chart
- Stop-Loss: $1,285, daily neckline
- Risk: $5
- Target: $1,265
- Reward: $15
- Risk-Reward Ratio: 1:3
