Just a bit over a month ago, Gilead Sciences' (NASDAQ:GILD) remdesivir antiviral drug looked like the big hope for coronavirus treatment. Investors went wild, putting a massive, knee-jerk bid on the Forest City, California biopharmaceutical company's stock, sending shares soaring 11% higher in early trading on April 29, when the news of its efficacy in a critical trial was released.
The stock gained $22.59, or 35.74% between Jan. 31 and April 29, but since then it's been sinking. That's because additional research has been tepid on remdesivir's curative value.
While results have shown that the experimental drug can help people with a mild case of COVID-19, it isn’t the panacea that will end the novel coronavirus once and for all.
Many were skeptical from the beginning, since there's a long road from early trials to the actual launch of a finished medical product. And if disappointing fundamentals weren't enough, technicals are now also signaling that the stock is about to end its uptrend.

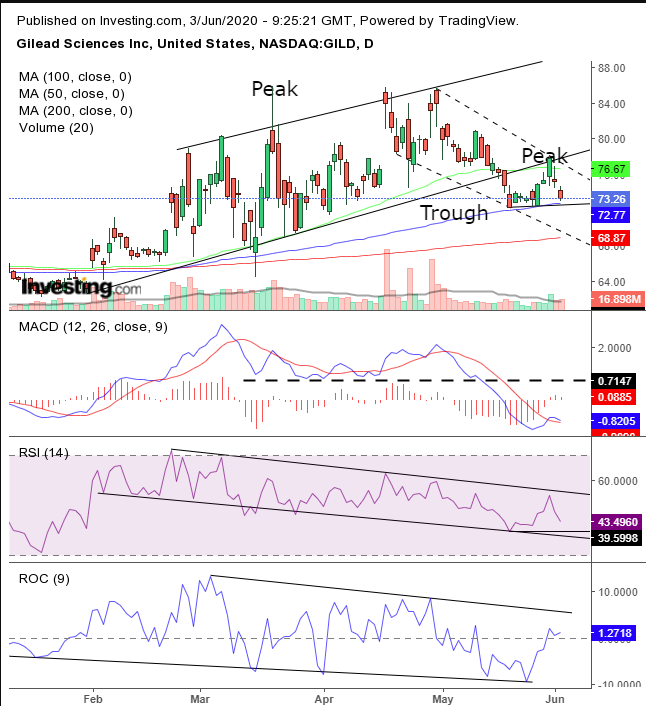
Hopes for a COVID-19 cure pushed the price into an uptrend after being trendless since the Dec. 26, 2018 bottom of $60.32. However, the stock fell below its uptrend and a rising channel bottom on May 15, putting into question the endurance of the trend.
A second red flag occurred when the price climbed back above the channel bottom but failed to maintain those heights. It has been falling ever since, toward the May 19 low of $72.30, when the price penetrated the rising channel.
Note that that the 50 DMA realigned with the channel bottom, while the 100 DMA supports the initial penetration low. A fall below $72 would not only break the support of the 100 DMA but will have then registered a second, lower trough, completing a downtrend.
Momentum provided a heads up that the price uptrend is unsustainable—giving a negative divergence as it fell against the rising price. The MACD demonstrated that a range of prices have been in decline. The recent return move to retest the bottom of the channel—which has held—pulled the short MA above the long MA. However, it's now falling back down.
Our only concern is the lack of volume-spike with the downside breakout. That would demonstrate significant interest. Instead, a return move—in both directions—was accompanied by higher volume.
While volume is important, it’s secondary to price. A fall below $70 would establish a peak-and-trough downtrend, the bread-and-butter of technical analysis.
Trading Strategies
Conservative Traders would wait for the second trough, preferably to include the 200 DMA, currently at $68.87, then for a corrective rally before committing to a short position.
Moderate traders are likely to wait for the second trough and for the profit-taking bounce, for a better entry, not necessarily for trend confirmation.
Aggressive traders may short at will, providing they know how to construct a coherent trading plan and follow through.
Trade Sample – Short Position Setup
- Entry: $75 – on the rebound
- Stop-Loss: $77
- Risk: $2
- Target: $69
- Reward: $6
- Risk:Reward Ratio: 1:3
