By Pinchas Cohen
On Monday and Tuesday, we provided analyses and trade strategies for the loonie and peso versus the dollar on the NAFTA renegotiations. Today, we provide analysis and trade strategies on NAFTA with no dollar risk, by analyzing the relative risk between the trading partners.
Canada’s economy grew 2.5 percent in the first half of the year, and the outlook for the second half is 1.5 – 2.00 percent. Mexico’s economy grew 2.3 percent, with a second-half outlook of 1.5-2.5 percent. So, while Canada’s economy grew somewhat more, Mexico’s potential for the second half is higher.
The reopening of NAFTA’s agreement, with the very tall shadow of a wall on the border with Mexico (who is being threatened to pay for it), means anything goes.
The very heart of Donald Trump’s campaign was tearing up agreements around the world. During the campaign, his target audience was blue collar workers who suffered the most from manual jobs being exported – people who would benefit from tearing up NAFTA.
But despite his raucous campaign rhetoric, Trump's administration has arrived at the negotiation table with uncharacteristic quiet. Some have misinterpreted this as a loss of interest. Trump critics say the lack of rhetoric is due to Trump’s focus on the east rather than the north, and Trump supporters say that the master negotiator is keeping his cards close to his chest. Either way, the Trump administration came swinging at NAFTA with a list of demands and harsh words.
Of the two partners to the US, Mexico is more reliant on exports than Canada for a number of reasons. Canada reduced its trade balance, its economy took to life thanks to their 87-percent export to the US, and it became more attractive to foreign investments after China’s manufacturing average salary rose to $3.60 per hour, while Mexico’s declined to $2.10 an hour.
An end to the agreement could be the end to Mexico’s exceptional export growth.
Canada, on the other hand, already exported 99 percent of its oil to the US – before any agreement.
The fact is that Canada has enough confidence to walk away if things don’t go its way, while Mexico is desperate enough to threaten an end to cooperation in matters of immigrants and security. Canada even thinks it can improve the deal in its favor, with a thinner boarder and a reduction of US limits on sugary products.
CAD/MXN: The Fundamentals
The Mexican peso had the sharpest rise on record this year, after its extreme fall last year, for two primary reasons. One, Trump’s NAFTA and wall rhetoric; two, it has become the quintessential hedge to represent emerging markets as it is the most liquid EM currency. (This liquidity is due to its being the 9th biggest oil exporter, requiring countries buy the Mexican peso to pay for its oil, as well as its 87% export to the US which requires the US to buy peso to pay for its exports, and finally as a result of the black market, per Trump’s accusations).
The Mexican rise may have reached a top, within which the CAD/MXN pair would constitute a bottom.
 –––––
–––––
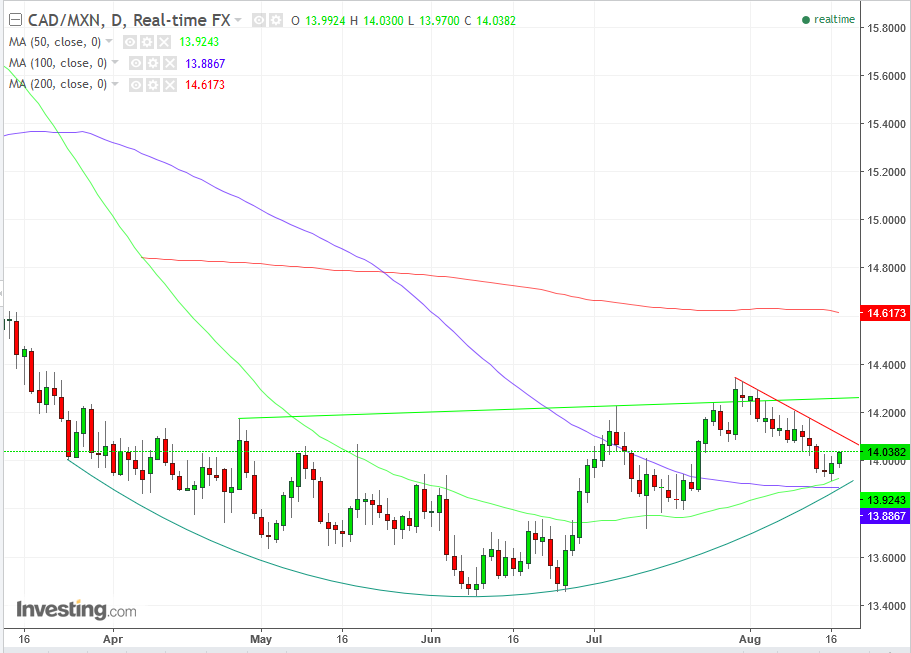
The pair fell almost 20 percent since the beginning of the year, but its successive peaks and troughs have been interrupted and began to form rising peaks and troughs in a rounded fashion. Should the neckline, drawn across the pattern’s peaks be decisively overcome, it would signal a reversal of a Rounding Bottom, named by its shape.
The July 28 peak corrected with a decline that seems to have ended on Tuesday, finding support of the 50 dma (green), which just crossed over the 100 dma (blue), providing a buy signal with the execution of a golden cross.
Trading Strategies
Conservative traders would wait for a decisive break of the neckline and previous July 28, 14.3500 peak.
Moderate traders might buy on a dip toward the support of the pattern and 50 and 100 dma’s, at 13.9 or upon a close above the short-term downtrend line since July 28 (red).
Aggressive traders who are not looking for a quick in-and-out but are willing to stay put during the much-expected volatility may enter now.
Price Targets
- The pattern will be complete with a decisive close – employed by using filters, 1 to 3 percent based on risk aversion - above its neckline, at around 14.3000.
- The pattern height of 7,000 pips will be the implicated next move, setting the minimum pattern target at 14.8700.
Stop Losses
Stop losses should be implemented with a minimum of a favorable 3:1 ratio of the target.
The farthest stop loss would be beneath the June 9, 13.4414 low, a 5,900-pip risk, from the current price. This sets a 3:1 ratio target with a 17,700-pip move to 15.7380.
A moderate stop loss would be beneath the established, former July 12, 13.7174 trough, a 13,219 risk, from the current price. This sets a 3:1 ratio target with a 3,960 move toward 14.4350.
A close stop loss would be beneath the 100 dma (blue), at 13.8867, a 1,497-pip risk. This sets a 3:1 ratio target with a 4,490-pip move to 14.4835, from the current price.
For traders waiting for Rounding Bottom completion upon the decisive break of the neckline, use the same calculation from your point of entry, while incorporating risk assessment of resistances, such as the 200 dma (red), currently at 14.6173 and psychological round numbers.
