Bitcoin (BTC), the most popular cryptocurrency by market cap, appears to be losing its status as a safe haven asset after having fallen in value on both risk-on and risk-off days this week.
As the equity market selloff in late July commenced, the digital currency surged toward $14,000. And true to its volatile nature, BTC's value increased by as much as a third during a week and a half.
While enthusiasts used this 33% return over a 10-day period as evidence of its haven status, the situation has now reversed. Bitcoin just shed as much as 21.25% in the past seven days. As of today, the overall crypto market has lost as much as $25 billion. Conventional wisdom says that's because Binance, the market's largest crypto exchange, just went offline for scheduled maintenance.
But even as the S&P 500 fell 1.85% during the selloff that took place on Friday and Monday, conventional safe havens popped: gold jumped 1%, the yen gained 0.75% and Treasurys moved higher by 4.6%. Conversely, Bitcoin lost 4.4% during the same period, ironically, well more than double the S&P 500 decline. And this was before Binance went down.
Still, whether Bitcoin has lost its safe haven mojo or not, technicals are signaling a bounce.

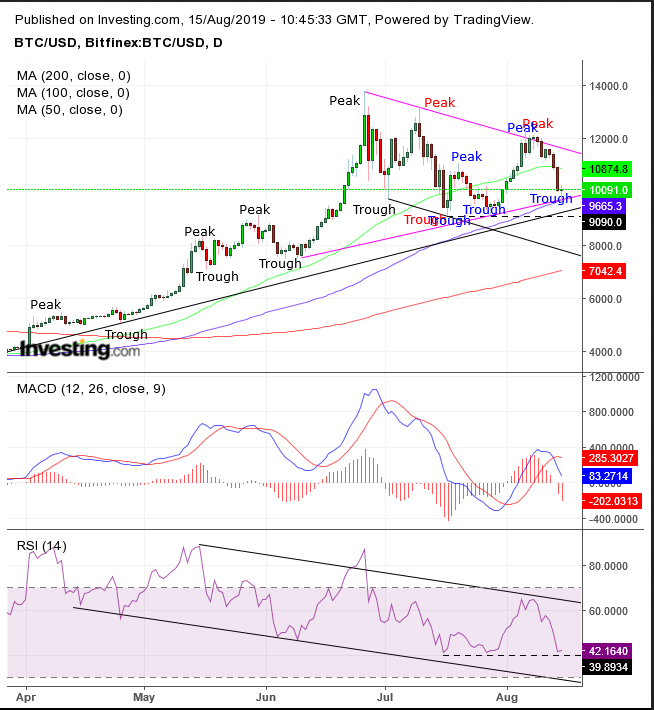
Bitcoin's chart is as complex and dynamic as its market environment. Three trends have developed: long term it's been up since March (black peaks and troughs); medium term, it's down since June if considering the peak and trough from the uptrend, or sideways if demanding two independent falling peaks and troughs (red peaks and troughs); and in the short term it's been up since July 17, if considering the medium term’s peak and trough (blue peaks and troughs).
The colliding trends formed a symmetrical triangle, in which supply and demand may oppose for three reasons: bulls vs bears; the same investors buy and sell when the price reaches extremes; and some investors are trading in different time frames.
There has been an argument among technicians for a long time about the implied market mechanics of a symmetrical triangle (purple). One school insists it’s a continuation pattern with the consolidation interrupting the trend. Since the trend has been rising since March, they would expect the breakout to be to the upside.
The second school believes the market is neutral as both buyers and sellers are equally eager, both upping the ante in their favored direction...till they meet in the middle and the more committed side breaks out of the pattern. While we don’t presume the underlying up-trend will necessarily dominate, we are willing to give an upside breakout a few extra points.
The price has been trading within a falling channel since June 27, in which both buyers and sellers agree that prices should continue lower. That outlook increases the odds of a continued slide.
Both the MACD and the RSI have been falling, and the former’s longer MA fell below the shorter MA, triggering a sell signal.
Still, while there are technical reasons to support both bulls and bears, timing and opportunity must also be considered. Since Bitcoin bounced off the bottom of the pattern, which also happened to be the key 10,000 level—which it's been bouncing for a whole month—it's been developing a hammer, causing the RSI to find support at the 42 level. As such, we see a bounce toward the top of the triangle as the most likely scenario.
Trading Strategies
Conservative traders would wait for the long-term trend to resolve.
Moderate traders would wait for a breakout of the symmetrical triangle.
Aggressive traders may enter a long position toward the triangle top.
Trade Sample
