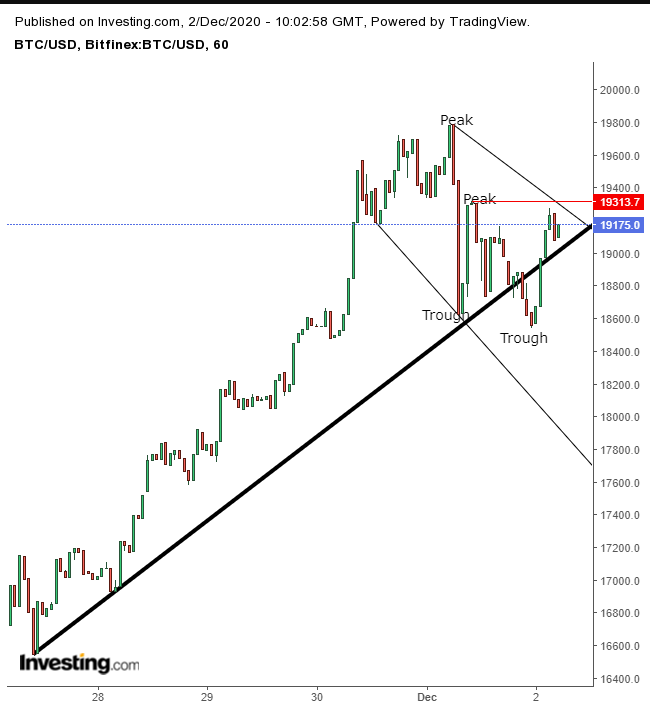
Bitcoin has been wavering, fluctuating between a 2.3% gain and 0.9% loss today, remaining little changed around the $19K level at the time of writing.
Yesterday, the price of the cryptocurrency plunged 4.5%, more than cutting in half Monday’s 8.2% gains. The retreat comes after the leading digital currency recorded its highest close, $19,892 on some exchanges, since its inception, though it failed to hit a new all-time high.
To be sure, Bitcoin has provided fantastic returns for investors. Even after yesterday’s drop, the digital asset is up 160% year-to-date. Plus, almost half of that was achieved in the last two months alone.
That's jawdropping, but that's also what makes us so cautious about the cryptocurrency. The fastest horse provides the wildest ride, and it takes an accomplished rider to keep on riding, even when they sometimes take a fall.
While the fundamental drivers of this new-era asset are often murky, this time there's a clear technical explanation: the resistance of both the all-time high, compounded by the approach of the psychological round figure at $20,000.
Whenever traders go “where no one has gone before,” there's always an attendant fear of unknown disaster. Investors may remember the near decimation of Bitcoin, at the end of 2017 into 2018 when the cryptocurrency fell from under $20,000 to almost $3,000, losing 84% of value in less than 11 months.
Now however, institutions that previously wrote off Bitcoin as a passing fad have begun warming up to the asset as some global investing norms have been changing, both before and during the global pandemic. Included in the shift: more financial advisors and institutions are including Bitcoin in clients’ portfolios—for both profit and diversification. That will help the famously volatile digital token gain additional legitimacy, and probably greater stability.
Once Bitcoin breaks the psychological $20,000 barrier, that could become the floor. For now, however, we're seeing a short-term move lower that nimble traders can take advantage of, provided they are disciplined.

Earlier, BTC/USD dipped below its uptrend line, in place since Nov. 27. It's climbed back up since, but has found resistance by its previous peak—registered yesterday—forming a Bearish Engulfing pattern.
If the price were to fall back below that line, then drop beneath yesterday’s low, it would confirm a newly established downtrend, in the short-term. Given the current dynamics for the cryptocurrency, there would be more selling than buying.
We expect this to continue until the supply-demand balance forms two rising peaks and troughs.
Trading Strategies
Conservative traders would sit out the short-term and wait for the longer term, when the trend flips back up.
Moderate traders would risk a short position, if the price falls below the Nov. 27, $16,600 trough.
Aggressive traders may take advantage of a short right now, provided they follow a preset, coherent plan.
Here’s an example:
Trade Sample
- Entry: $19,000
- Stop-Loss: $19,100
- Risk: $100
- Target: $18,000
- Reward: $1,000
- Risk:Reward Ratio: 1:10
