The US House of Representatives Judiciary Committee is exepected to release a report later this week, accusing four megacap technology behemoths—Amazon (NASDAQ:AMZN), Apple (NASDAQ:AAPL), Facebook (NASDAQ:FB) and Alphabet (NASDAQ:GOOGL)—of anti-competitive business practices. The findings by lawmakers, which essentially describe the four tech giants as gatekeepers of the digital economy, could ultimately lead to new anti-trust legislation triggering the breakup of each of these companies.
Of course, any change in the structure and business practices of any or all of these companies is likley to hurt profits. And with Amazon shares skyrocketing on the surge in online pandemic shopping that boosted the stock to an all-time closing high on Sept. 2 of $3,531.45, from which the stock is now off 12%, might investors suddenly turn jittery on this Wall Street darling? Could the headlines be a reason for stakeholders to turn tail and dump shares?

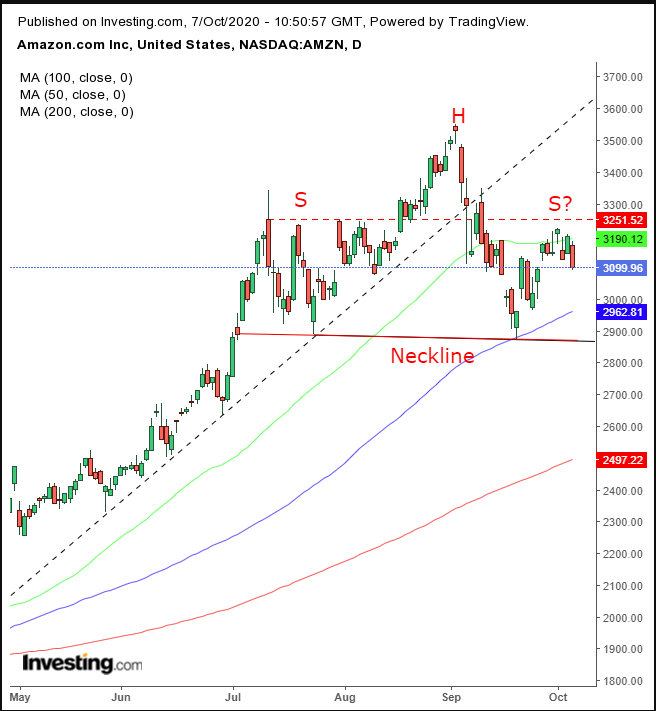
The stock failed to produce another high following the early September record price. Supply overcame demand, pushing prices below the July-August highs.
The price has finally found support on the July 24 trough. However, the previous presumed support, the highs seen in July and August that drowned out demand, became a supply stronghold, as traders remembered the 11.4% plunge that occured the last time the price hit that level in early September.
This trading pattern developed a H&S top, complete with a downside breakout, which occurs when the price falls below the previous lows, as marked by the neckline.
What are the psychological drivers of a H&S top? It's an indicator that 'smart money' shareholders are expecting a decline, and thus have decided to divest their shares at the highest prices, in order to accumulate them once again after the fall, for next to nothing, while walking away with some serious profit.
We're not saying 'informed money,' aka insiders or large shareholders who are closer to the company than smaller, retail investors, is knowingly dumping overpriced shares, though that could be possible, if not necessarily legal. But even if there was no 'informed money' influence, investors tend to react to headlines, and yesterday's was big news for Amazon and its peers.
Still, we’ve conducted some research based on different timelines. What we found was that most of the headlines concerning the antitrust investigation were released from June through August. And that left shoulder of the H&S top developed from July through August. So with more headlines likely forthcoming, one should anticipate additional declines to be forthcoming.
Plus, if the price falls below $2,800, it will have completed a reversal pattern, implying another drop to $2,300.
Trading Strategies
Conservative traders would consider a short after the price falls at least 3% from the neckline, currently at $2,860, over the course of 3 days, preferably to include a weekend. Then they’d wait for the usual return move—driven with covered shorts—to “retest” the pattern’s integrity: technical-speak meaning if the H&S top proves true, it will provide sufficient remaining supply to absorb the demand created by short covering and drive prices again. Once the short covering is over for this leg, it will form the set-up for a second leg lower.
Moderate traders are likely to wait for the same downside breakout, but unlike conservative traders be content with just a 2% / 2-day filter.
Aggressive traders may short upon a 1% / 1-day downside breakout. Meanwhile, they can trade the range, between the shoulder-top and neckline. Here’s an example:
Aggressive Short Position
Entry: $3,200 – testing the Evening Star, from Sept. 29-Oct. 2
Stop-Loss: $3,250
Risk: $50
Target: $2,900 – neckline support
Reward: $300
Risk:Reward Ratio: 1:6
Author's Note: The above is just a trade sample, not a complete analysis. That's in the body of the post. If you don’t read and understand the analysis, don’t make the trade. Its result will have been random, and you will have learned nothing from it. This is also not necessarily the correct trade for you, based on your timing, budget and temperament. Change it accordingly, and if you don’t know how to do that, don’t trade!
