Get 40% Off
⚠ Earnings Alert! Which stocks are poised to surge?
See the stocks on our ProPicks radar. These strategies gained 19.7% year-to-date.
Unlock full list

Chart Of The Day: After Stellar July, EUR/USD Arrives At Critical Juncture

Published 07/31/2020, 09:59 AM
Updated 03/11/2024, 07:10 AM

This article was written exclusively for Investing.com

The EUR/USD extended its gains first thing this morning as investors digested early European data which showed, among other things, better-than-expected French GDP and consumer spending, as well as German retail sales. However, the EUR/USD then eased off the highs amid profit-taking from key levels ahead of month-end and after Eurozone GDP, which was released later, came in slightly below expectations with a print of -12.1% in Q2 vs. -12.0% expected.

As we end July, the EUR/USD is still looking quite strong and like it will end positively for the third consecutive month. This month's 5.6% rise is the largest one-month increase in the value of the euro against the dollar since September 2010. However, with coronavirus making an unwelcome comeback to parts of Europe, the currency may come under pressure again in August. It is also possible that the dollar could rise from the ashes, as virus cases in the US start to drop and the most populous states open up again. So, the EUR/USD’s rally could potentially end. 

But we will let the charts guide us, rather than taking a macro view on the direction of rates.

In fact, the monthly chart of the EUR/USD shows price has reached a critical technical juncture between around 1.1850 to 1.2000. Here, an old support and resistance area meets a long-term bearish trend line, derived from connecting the previous significant highs:
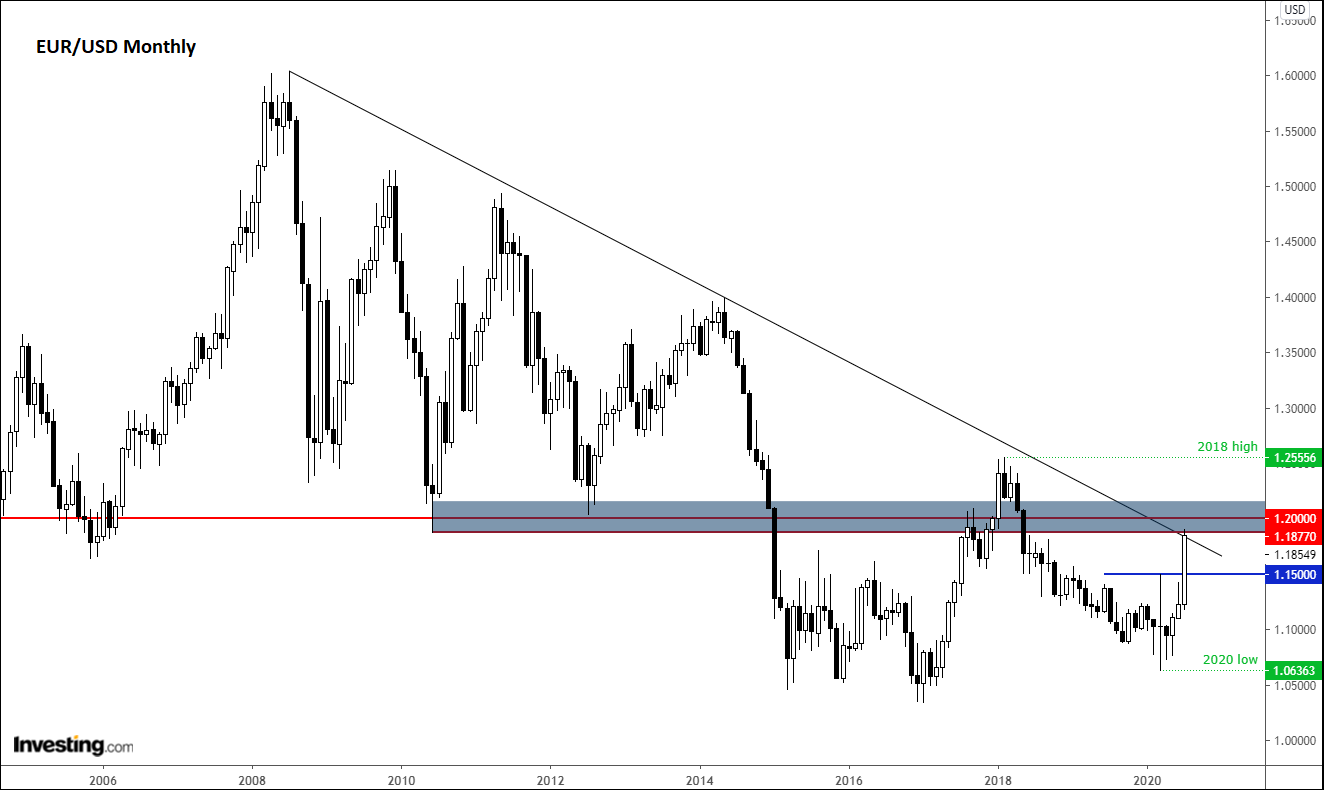
Monthly EUR/USD Technicals

The EUR/USD is testing this monthly resistance area and, as the daily shows, the price is potentially reaching significantly “overbought” levels on the daily time frame, if the Relative Strength Index (RSI) is anything to go by:
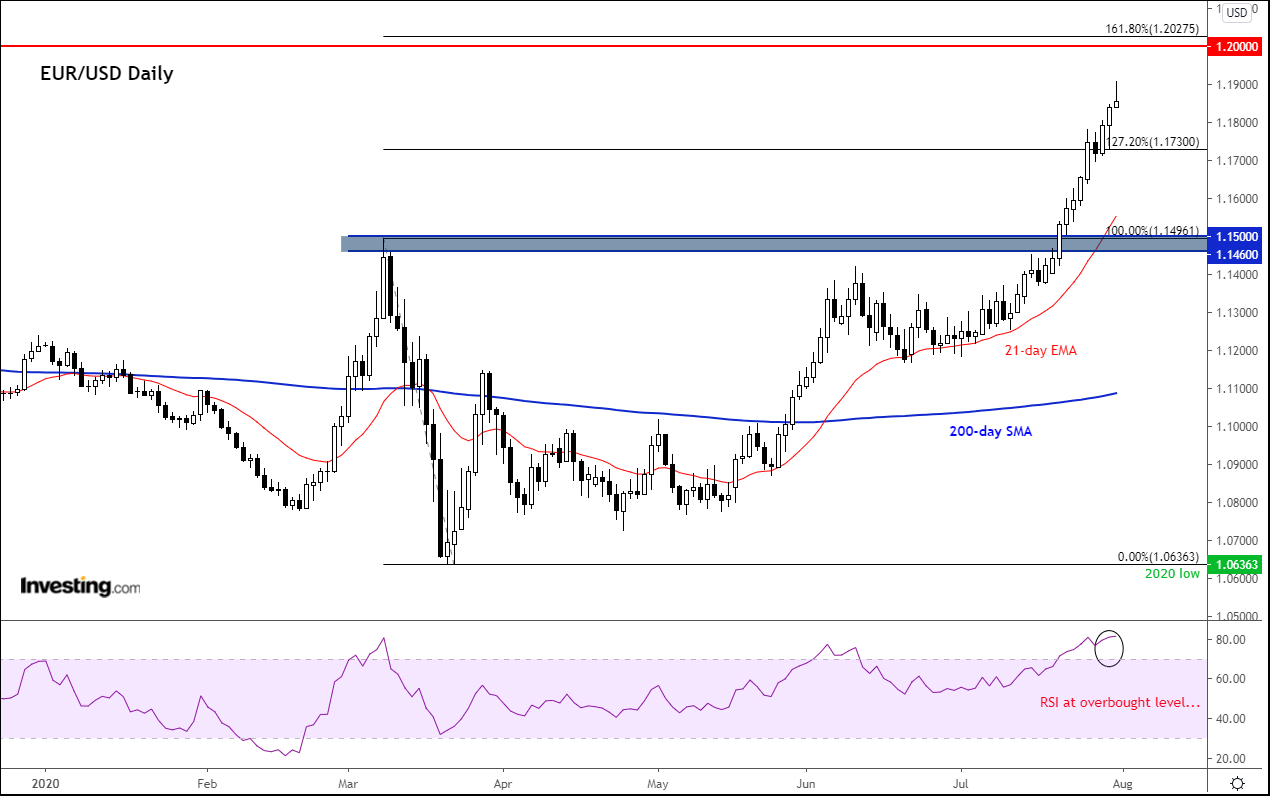
Daily EUR/USD Technicals

Thus, given the above considerations, at the very least I would expect price to ease back a little on profit-taking from these overbought and technically-important levels. 

What happens next will depend to a great degree on the macro factors obviously, but from purely a technical point of view, the bulls would want to see a small retracement and a period of consolidation—for this would point to weak selling pressure. If this turns out to be the case, the EUR/USD may go on to break through the abovementioned resistance zone before heading towards the 2018 high at 1.2555.

However, a sharp retreatment from this 1.1850-1.2000 resistance zone would indicate strong downward pressure. If seen, I wouldn’t rule out a return to the point of origin of the breakout to about 1.1460-1.1500 in the coming weeks. 

Latest comments

US virus cases is still rising 1460 for the past 3 or 4 days now..... what cases dropping ??? don't write      anything on your sorry bias vision ... your analysis lacks a lot of facts  here.
Typo 1400+ is the  dead people daily ,  Covid new cases on July 31 is 70904.
“The market may remain irrational longer than you cam remain solvent” The gold is overbought, the euro is overbought, the stocks are overbought but it seems they will remain overbought for a long time. I expect a recovery after US elections since all the fuss is about Trump and his incompetent administration.
Risk Disclosure: Trading in financial instruments and/or cryptocurrencies involves high risks including the risk of losing some, or all, of your investment amount, and may not be suitable for all investors. Prices of cryptocurrencies are extremely volatile and may be affected by external factors such as financial, regulatory or political events. Trading on margin increases the financial risks.
Before deciding to trade in financial instrument or cryptocurrencies you should be fully informed of the risks and costs associated with trading the financial markets, carefully consider your investment objectives, level of experience, and risk appetite, and seek professional advice where needed.
Fusion Media would like to remind you that the data contained in this website is not necessarily real-time nor accurate. The data and prices on the website are not necessarily provided by any market or exchange, but may be provided by market makers, and so prices may not be accurate and may differ from the actual price at any given market, meaning prices are indicative and not appropriate for trading purposes. Fusion Media and any provider of the data contained in this website will not accept liability for any loss or damage as a result of your trading, or your reliance on the information contained within this website.
It is prohibited to use, store, reproduce, display, modify, transmit or distribute the data contained in this website without the explicit prior written permission of Fusion Media and/or the data provider. All intellectual property rights are reserved by the providers and/or the exchange providing the data contained in this website.
Fusion Media may be compensated by the advertisers that appear on the website, based on your interaction with the advertisements or advertisers.
© 2007-2024 - Fusion Media Limited. All Rights Reserved.